x1 <- c(rep(-0.975, 1000), rep(0.975, 1000))
x1 <- (x1 - mean(x1)) / sd(x1)
x2 <- rnorm(2000)
x2 <- (x2 - mean(x2)) / sd(x2)
x3 <- qchisq(seq(0.26, 0.8, 0.0005), 4)
x3 <- (x3 - mean(x3)) / sd(x3)
dists_mean0_sd1 <- tibble(
  x = c(x1, x2, x3),
  group = c(rep("A", length(x1)), rep("B", length(x2)), rep("C", length(x3)))
)
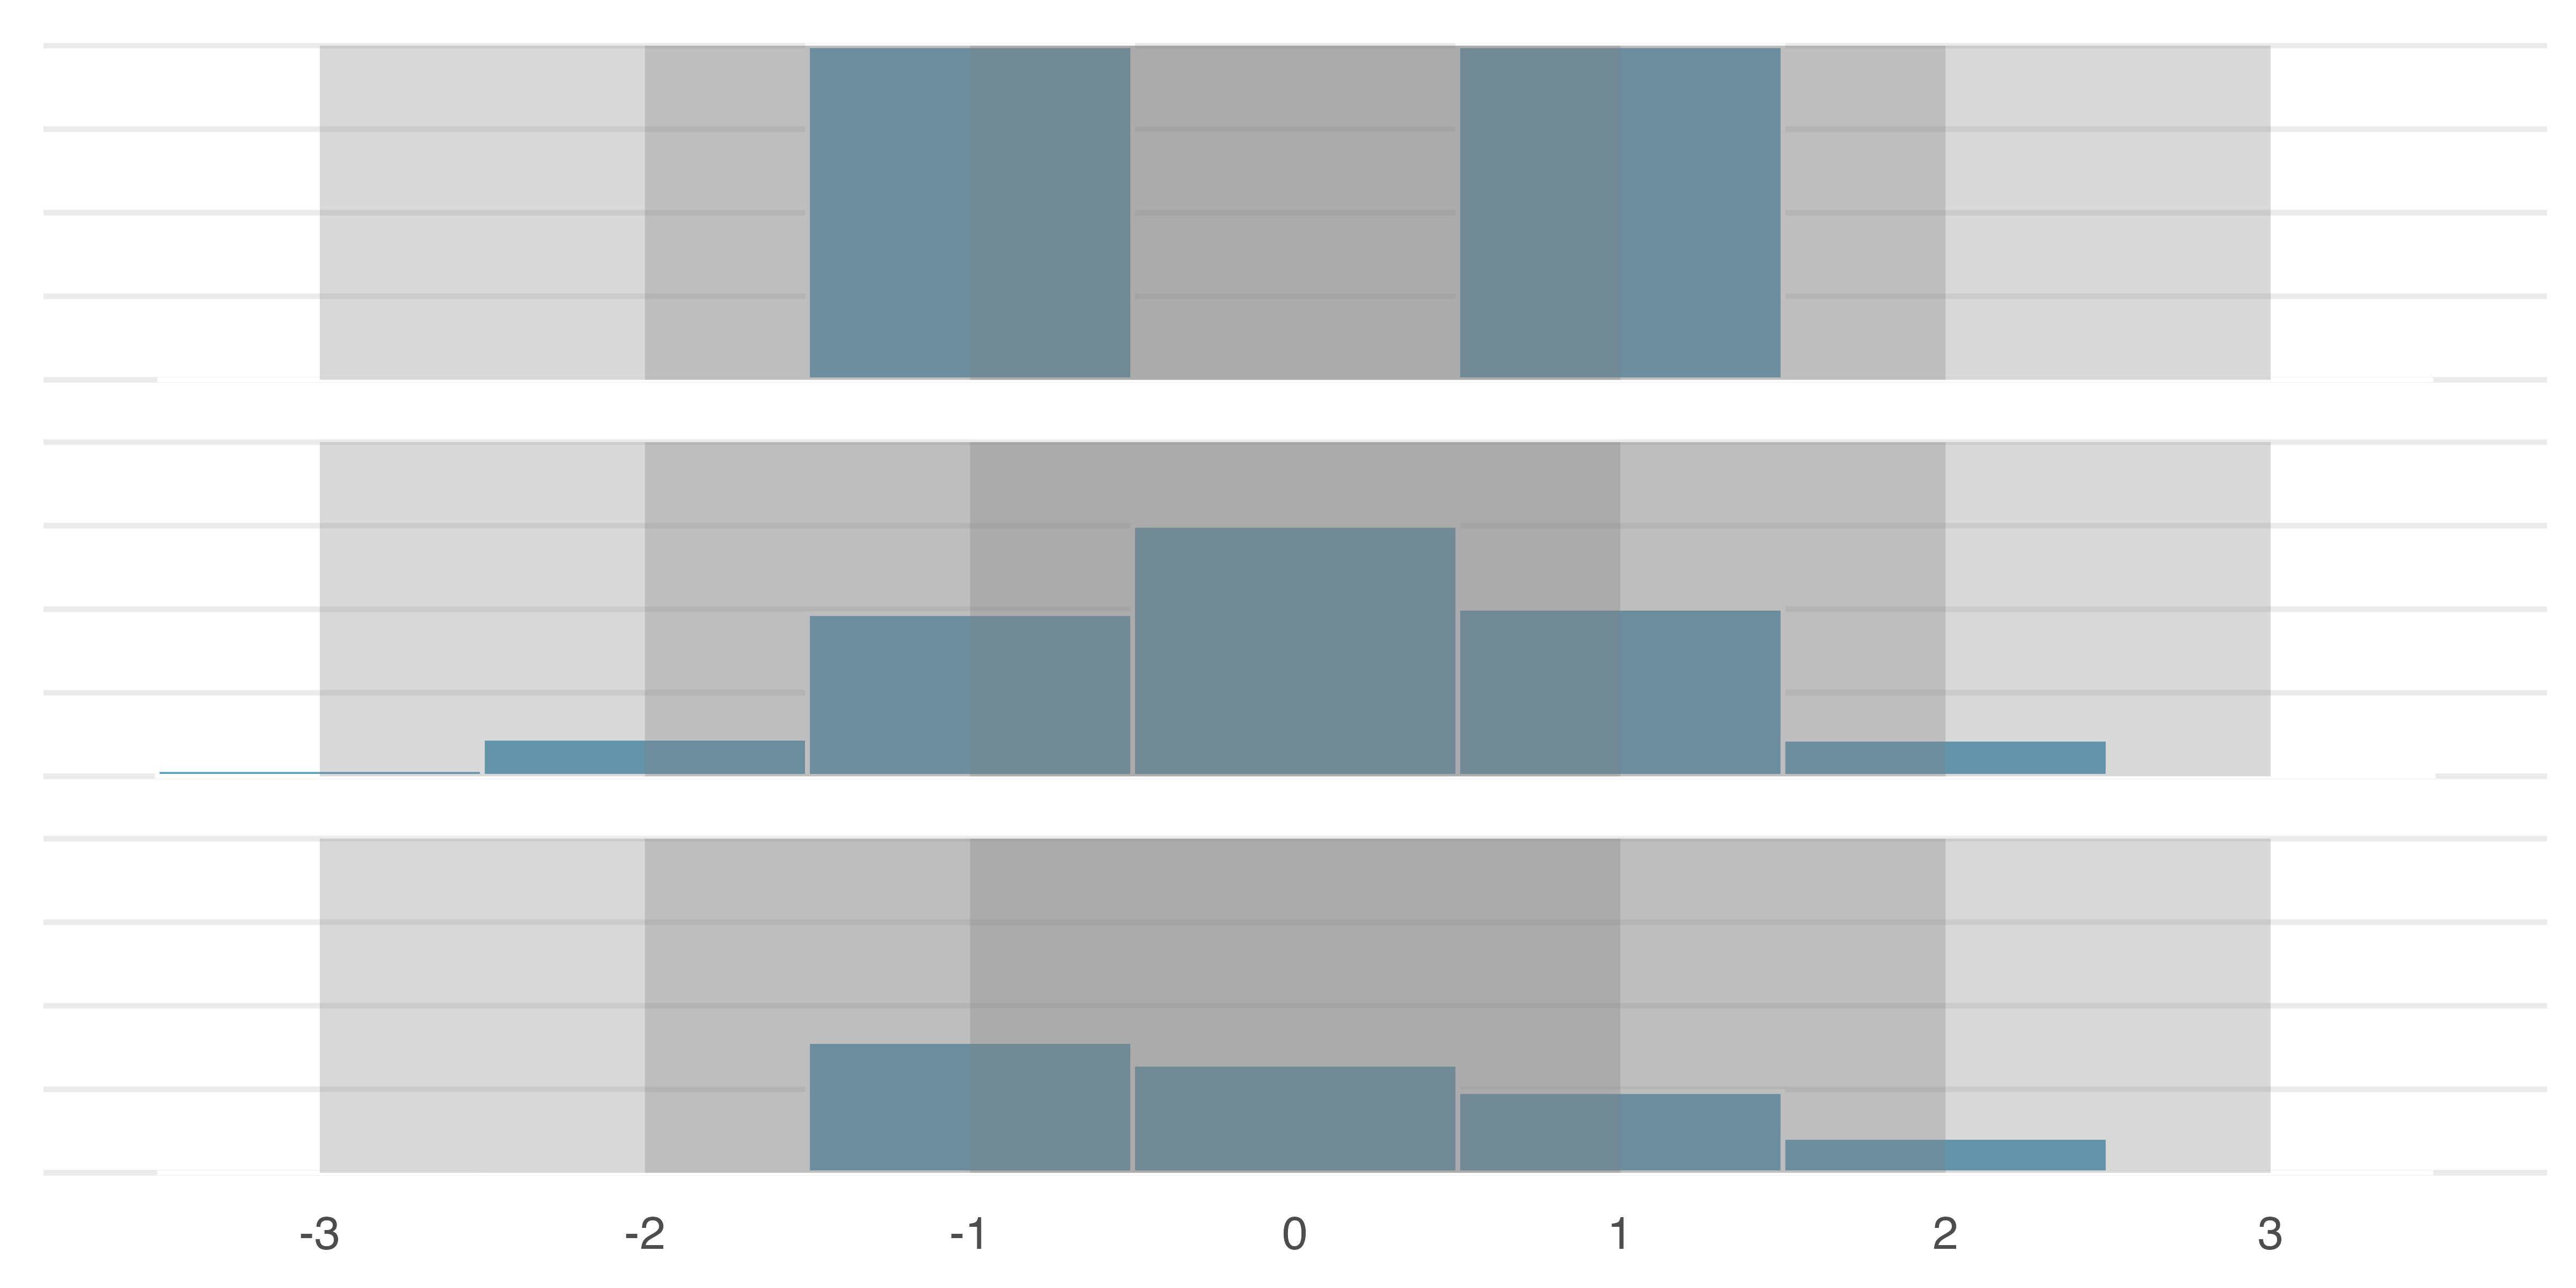
ggplot(dists_mean0_sd1, aes(x = x)) +
  geom_histogram(binwidth = 1) +
  facet_grid(group ~ ., scales = "free_y") +
  theme(
    # remove y axis
    axis.title.y = element_blank(),
    axis.text.y = element_blank(),
    axis.ticks.y = element_blank(),
    # strip facet labels
    strip.background = element_blank(),
    strip.text.y = element_blank()
  ) +
  scale_x_continuous(breaks = seq(-3, 3, 1)) +
  labs(x = NULL) +
  geom_polygon(
    data = tibble(x = c(-1, -1, 1, 1), y = c(0, 1000, 1000, 0)),
    aes(x = x, y = y), fill = IMSCOL["gray", "f5"], alpha = 0.3
  ) +
  geom_polygon(
    data = tibble(x = c(-2, -2, 2, 2), y = c(0, 1000, 1000, 0)),
    aes(x = x, y = y), fill = IMSCOL["gray", "f5"], alpha = 0.3
  ) +
  geom_polygon(
    data = tibble(x = c(-3, -3, 3, 3), y = c(0, 1000, 1000, 0)),
    aes(x = x, y = y), fill = IMSCOL["gray", "f5"], alpha = 0.3
  ) +
  theme(
    panel.grid.major.x = element_blank(),
    panel.grid.minor.x = element_blank(),
    panel.grid.minor.y = element_blank()
  )