Section 4.14 Create an animation from multiple R plots
When you generate a series of plots in a code chunk, you can combine them into an animation. It is easy to do so if the output format is HTML — you only need to install the gifski package [25] and set the chunk option
animation.hook = "gifski". Below is a simple “Pac-man” animation created from the code chunk below:
```{r, animation.hook="gifski"}
for (i in 1:2) {
  pie(c(i %% 2, 6), col = c('red', 'yellow'), labels = NA)
}
```
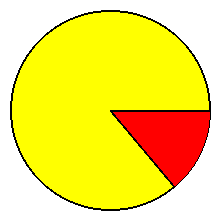
The image format of the animation is GIF, which works well for HTML output, but it is not straightforward to support GIF in LaTeX. That is why you only see two static image frames in Figure 4.14.1 if you are reading the PDF or printed version of this book. If you read the online version of this book, you will see the actual animation.
Animations can work in PDF, but there are two prerequisites. First, you have to load the LaTeX package animate (see Section 6.4 for how). Second, you can only use Acrobat Reader to view the animation. Then the chunk option
fig.show = "animate" will use the animate package to create the animation. Below is an example:
---
title: Animations in PDF
output:
  pdf_document:
    extra_dependencies: animate
---

The animation below can only be viewed in Acrobat Reader.

```{r, fig.show='animate'}
for (i in 1:2) {
  pie(c(i %% 2, 6), col = c('red', 'yellow'), labels = NA)
}
```
The time interval between image frames in the animation can be set by the chunk option
interval. By default, interval = 1 (i.e., one second).
