Section 13.5 Embed an interactive 3D plot with rgl
The rgl package [50] can be used to generate interactive 3D plots. These plots can still be interactive if they are saved to the WebGL format, which can be done through a hook function
rgl::hook_webgl(). Below is an example that shows you how to set up rgl and knitr so 3D plots can be saved while preserving the interactivity:
---
title: Embed 3D plots with rgl
output: html_document
---
Set up a hook to save **rgl** plots:
```{r, setup}
library(rgl)
knitr::knit_hooks$set(webgl = hook_webgl)
```
See if it works for this 3D plot after we enable the hook
via the chunk option `webgl = TRUE`:
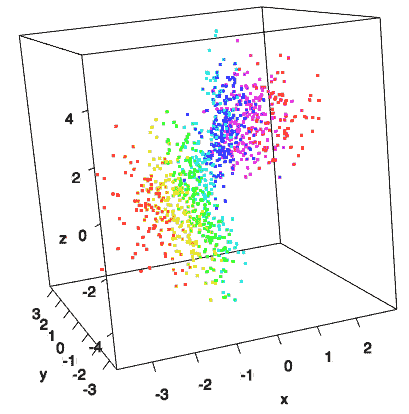
```{r, test-rgl, webgl=TRUE}
x <- sort(rnorm(1000))
y <- rnorm(1000)
z <- rnorm(1000) + atan2(x,y)
plot3d(x, y, z, col = rainbow(1000))
```
You should get an interactive 3D scatterplot like Figure 13.5.1 after you compile this example. Note that the interactive plots only work when the output format is HTML.