Section 17.4 Parameterized reports
In Section 17.3, we mentioned one way to render a series of reports in a
for-loop. In fact, rmarkdown::render() has an argument named params specifically designed for this task. You can parameterize your report through this argument. When you specify parameters for a report, you can use the variable params in your report. For example, if you call:
for (state in state.name) {
  rmarkdown::render('input.Rmd', params = list(state = state))
}
---
title: "A report for `r params$state`"
output: html_document
---

The area of `r params$state` is
`r state.area[state.name == params$state]`
square miles.
Another way to specify parameters for a report is to use the YAML field
params, e.g.,
---
title: Parameterized reports
output: html_document
params:
  state: Nebraska
  year: 2019
  midwest: true
---
Note that you can include as many parameters in the
params YAML field or the params argument of rmarkdown::render(). If both the YAML field and the argument are present, the parameter values in the argument will override the corresponding parameters in YAML. For example, when we call rmarkdown::render(..., params = list(state = 'Iowa', year = 2018)) on the previous example that has the params field, params$state will become Iowa (instead of Nebraska) and params$year will become 2018 (instead of 2019) in the R Markdown document.
When rendering the same R Markdown document to a series of reports, you need to adjust the
output_file argument of rmarkdown::render(), to make sure each report has its unique filename. Otherwise, you will accidentally override certain report files. For example, you can write a function to generate a report for each state and each year:
render_one <- function(state, year) {
  # assuming the output format of input.Rmd is PDF
  rmarkdown::render(
    'input.Rmd',
    output_file = paste0(state, '-', year, '.pdf'),
    params = list(state = state, year = year),
    envir = parent.frame()
  )
}
Then you can use nested
for-loops to generate all reports:
for (state in state.name) {
  for (year in 2000:2020) {
    render_one(state, year)
  }
}
At the end, you will get a series of report files like
Alabama-2000.pdf, Alabama-2001.pdf, ..., Wyoming-2019.pdf, and Wyoming-2020.pdf.
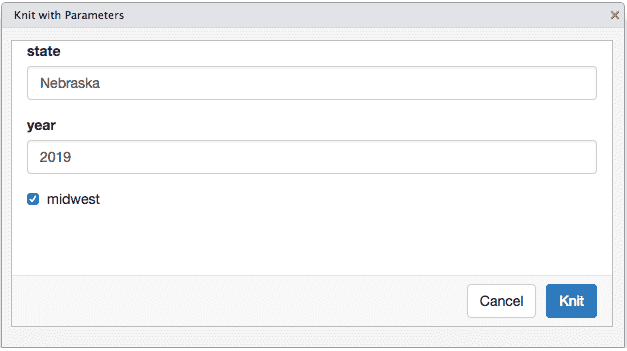
For parameterized reports, you can also input parameters interactively through a graphical user interface (GUI) created from Shiny. This requires you to provide a
params field in YAML, and rmarkdown will automatically create the GUI using the appropriate input widgets for each parameter (e.g., a checkbox will be provided for a Boolean parameter).
rmarkdown::render('input.Rmd', params = 'ask')
If you use RStudio, you can click the menu Knit with Parameters behind the Knit button. Figure 17.4.1 shows an example GUI for parameters.
For more information on parameterized reports, you may read Chapter 15 of the R Markdown Definitive Guide [53].
