Section 10.1 The function knitr::kable()
The
kable() function in knitr is a very simple table generator, and is simple by design. It only generates tables for strictly rectangular data such as matrices and data frames. You cannot heavily format the table cells or merge cells. However, this function does have a large number of arguments for you to customize the appearance of tables.
kable(x, format, digits = getOption("digits"), row.names = NA,
  col.names = NA, align, caption = opts_current$get("tab.cap"),
  label = NULL, format.args = list(), escape = TRUE, ...)
Subsection 10.1.1 Supported table formats
In most cases,
knitr::kable(x) may be enough if you only need a simple table for the data object x. The format argument is automatically set according to the knitr source document format. Its possible values are pipe (tables with columns separated by pipes), simple (Pandoc’s simple tables), latex (LaTeX tables), html (HTML tables), and rst (reStructuredText tables). For R Markdown documents, kable() uses the pipe format for tables by default, which looks like this:
knitr::kable(head(mtcars[, 1:4]), 'pipe')
|                   |  mpg| cyl| disp|  hp|
|:------------------|----:|---:|----:|---:|
|Mazda RX4          | 21.0|   6|  160| 110|
|Mazda RX4 Wag      | 21.0|   6|  160| 110|
|Datsun 710         | 22.8|   4|  108|  93|
|Hornet 4 Drive     | 21.4|   6|  258| 110|
|Hornet Sportabout  | 18.7|   8|  360| 175|
|Valiant            | 18.1|   6|  225| 105|
You can also generate simple tables, or tables in HTML, LaTeX, and reStructuredText:
knitr::kable(head(mtcars[, 1:4]), 'simple')
# kable(head(mtcars[, 1:4]), 'simple'):
                      mpg   cyl   disp    hp
------------------  -----  ----  -----  ----
Mazda RX4            21.0     6    160   110
Mazda RX4 Wag        21.0     6    160   110
Datsun 710           22.8     4    108    93
Hornet 4 Drive       21.4     6    258   110
Hornet Sportabout    18.7     8    360   175
Valiant              18.1     6    225   105
knitr::kable(mtcars[1:2, 1:2], 'html')
<table>
 <thead>
  <tr>
   <th style="text-align:left;">   </th>
   <th style="text-align:right;"> mpg </th>
   <th style="text-align:right;"> cyl </th>
  </tr>
 </thead>
<tbody>
  <tr>
   <td style="text-align:left;"> Mazda RX4 </td>
   <td style="text-align:right;"> 21 </td>
   <td style="text-align:right;"> 6 </td>
  </tr>
  <tr>
   <td style="text-align:left;"> Mazda RX4 Wag </td>
   <td style="text-align:right;"> 21 </td>
   <td style="text-align:right;"> 6 </td>
  </tr>
</tbody>
</table>
knitr::kable(head(mtcars[, 1:4]), 'latex')
\begin{tabular}{l|r|r|r|r}
\hline
  & mpg & cyl & disp & hp\\
\hline
Mazda RX4 & 21.0 & 6 & 160 & 110\\
\hline
Mazda RX4 Wag & 21.0 & 6 & 160 & 110\\
\hline
Datsun 710 & 22.8 & 4 & 108 & 93\\
\hline
Hornet 4 Drive & 21.4 & 6 & 258 & 110\\
\hline
Hornet Sportabout & 18.7 & 8 & 360 & 175\\
\hline
Valiant & 18.1 & 6 & 225 & 105\\
\hline
\end{tabular}
knitr::kable(head(mtcars[, 1:4]), 'rst')
=================  ====  ===  ====  ===
\                   mpg  cyl  disp   hp
=================  ====  ===  ====  ===
Mazda RX4          21.0    6   160  110
Mazda RX4 Wag      21.0    6   160  110
Datsun 710         22.8    4   108   93
Hornet 4 Drive     21.4    6   258  110
Hornet Sportabout  18.7    8   360  175
Valiant            18.1    6   225  105
=================  ====  ===  ====  ===
Please note that only the formats
pipe and simple are portable, i.e., they work for any output document format. Other table formats only work for specific output formats, e.g., format = 'latex' only works for LaTeX output documents. Using a specific table format will give you more control, at the price of sacrificing portability.
If you only need one table format that is not the default format for a document, you can set the global R option
knitr.table.format, e.g.,
options(knitr.table.format = 'latex')
This option can also be a function that returns the format string or
NULL. In the case of NULL, knitr will try to automatically decide the appropriate format. For example, we can use the latex format only when the output format is LaTeX:
options(knitr.table.format = function() {
  if (knitr::is_latex_output()) 'latex' else 'pipe'
})
Subsection 10.1.2 Change column names
The names of columns in a data frame may not be the same as what we want to display to readers. In R, the column names of data often do not use spaces to separate words but dots or underscores instead. We can use the
col.names argument to replace the column names with a vector of new names. For example, we substitute the dots with spaces in the column names of the iris data:
iris2 = head(iris)
knitr::kable(iris2, col.names = gsub('[.]', ' ', names(iris)))
| Sepal Length | Sepal Width | Petal Length | Petal Width | Species |
|---|---|---|---|---|
| 5.1 | 3.5 | 1.4 | 0.2 | setosa |
| 4.9 | 3.0 | 1.4 | 0.2 | setosa |
| 4.7 | 3.2 | 1.3 | 0.2 | setosa |
| 4.6 | 3.1 | 1.5 | 0.2 | setosa |
| 5.0 | 3.6 | 1.4 | 0.2 | setosa |
| 5.4 | 3.9 | 1.7 | 0.4 | setosa |
The
col.names argument can take an arbitrary character vector (not necessarily the modified column names via functions like gsub()), as long as the length of the vector is equal to the number of columns of the data object, e.g.,
knitr::kable(
  iris,
  col.names = c('We', 'Need', 'Five', 'Names', 'Here')
)
Subsection 10.1.3 Specify column alignment
To change the alignment of the table columns, you can use either a vector of values consisting of characters
l (left), c (center), and r (right) or a single multi-character string for alignment, so kable(..., align = c('c', 'l')) can be shortened to kable(..., align = 'cl'). By default, numeric columns are right-aligned, and other columns are left-aligned. Here is an example:
# left, center, center, right, right
knitr::kable(iris2, align = 'lccrr')
| Sepal Length | Sepal Width | Petal Length | Petal Width | Species |
|---|---|---|---|---|
| 5.1 | 3.5 | 1.4 | 0.2 | setosa |
| 4.9 | 3.0 | 1.4 | 0.2 | setosa |
| 4.7 | 3.2 | 1.3 | 0.2 | setosa |
| 4.6 | 3.1 | 1.5 | 0.2 | setosa |
| 5.0 | 3.6 | 1.4 | 0.2 | setosa |
| 5.4 | 3.9 | 1.7 | 0.4 | setosa |
Subsection 10.1.4 Add a table caption
You can add a caption to the table via the
caption argument, e.g.,
knitr::kable(iris2, caption = 'An example table caption.')
As we mentioned in Section 4.7, a table can be cross-referenced when it has a caption and the output format is from bookdown.
Subsection 10.1.5 Format numeric columns
You can set the maximum number of decimal places via the
digits argument (which will be passed to the round() function), and other formatting arguments via format.args (to be passed to the format() function in base R). First we show a few simple examples of round() and format() so you will understand how the arguments work later in kable():
round(1.234567, 0)
round(1.234567, digits = 1)
round(1.234567, digits = 3)
format(1000, scientific = TRUE)
format(10000.123, big.mark = ',')
## [1] 1
## [1] 1.2
## [1] 1.235
## [1] "1e+03"
## [1] "10,000.12"
Then we round and format numbers in a table:
Then we round and format numbers in a table:
d <- cbind(X1 = runif(3), X2 = 10^c(3, 5, 7), X3 = rnorm(3, 0, 1000))
# at most 4 decimal places
knitr::kable(d, digits = 4)
X1        X2          X3
------  ------  ----------
0.3539  1e+03   -1542.5533
0.2397  1e+05     723.3763
0.5100  1e+07    -571.9407
# round columns separately
knitr::kable(d, digits = c(5, 0, 2))
X1         X2          X3
-------  ------  ----------
0.35389  1e+03   -1542.55
0.23970  1e+05     723.38
0.50996  1e+07    -571.94
# do not use the scientific notation
knitr::kable(d, digits = 3, format.args = list(scientific = FALSE))
X1        X2           X3
------  -------  ----------
0.354     1000   -1542.553
0.240   100000     723.376
0.510  10000000    -571.941
# add commas to big numbers
knitr::kable(d, digits = 3, format.args = list(big.mark = ",",
  scientific = FALSE))
X1            X2           X3
------  ----------  ----------
0.354        1,000  -1,542.553
0.240      100,000     723.376
0.510   10,000,000    -571.941
Subsection 10.1.6 Display missing values
By default, missing values (i.e.,
NA) are displayed as the character string NA in the table. You can replace them with other values or choose not to display anything (i.e., leave the NA cells empty) with the global R option knitr.kable.NA, e.g., we make NA cells empty in the second table and display ** in the third table below:
d[rbind(c(1, 1), c(2, 3), c(3, 2))] <- NA
knitr::kable(d)  # NA is displayed by default
X1      X2      X3
------  ------  -------
NA      1e+03   -1542.6
0.2397  1e+05   NA
0.5100  NA      -571.9
# replace NA with empty strings
opts <- options(knitr.kable.NA = "")
knitr::kable(d)
X1      X2      X3
------  ------  -------
        1e+03   -1542.6
0.2397  1e+05
0.5100          -571.9
options(knitr.kable.NA = "**")
knitr::kable(d)
X1      X2      X3
------  ------  -------
**      1e+03   -1542.6
0.2397  1e+05   **
0.5100  **      -571.9
options(opts) # restore global R options
Subsection 10.1.7 Escape special characters
If you are familiar with HTML or LaTeX, you know that there are a few special characters in these languages. To generate safe output,
kable() will escape these special characters by default via the argument escape = TRUE, which means all characters will be generated verbatim, and special characters lose their special meanings. For example, > will be substituted with > for HTML tables, and _ will be escaped as \_ for LaTeX tables. If you are an expert and know how to use special characters properly, you may disable this argument via escape = FALSE. In the second table below, we include a few LaTeX math expressions that contain special characters $, \, and _:
m <- lm(dist ~ speed, data = cars)
d <- coef(summary(m))
knitr::kable(d)
            Estimate  Std. Error  t value  Pr(>|t|)
-----------  ---------  ----------  -------  ----------
(Intercept)   -17.579      6.7584   -2.601      0.0123
speed           3.932      0.4155    9.464      0.0000
# add a few math expressions to row and column names
rownames(d) <- c("$\\beta_0$", "$\\beta_1$")
colnames(d)[4] <- "$P(T > |t|)$"
knitr::kable(d, escape = FALSE)
            Estimate  Std. Error  t value  P(T > |t|)
---------  ---------  ----------  -------  ------------
beta_0       -17.579      6.7584   -2.601        0.0123
beta_1         3.932      0.4155    9.464        0.0000
Without
escape = FALSE, special characters will either be escaped or substituted. For example, $ is escaped as \$, _ is escaped as \_, and \ is substituted with \textbackslash{}:
knitr::kable(d, format = "latex", escape = TRUE)
\begin{tabular}{l|r|r|r|r}
\hline
  & Estimate & Std. Error & t value & \$P(T > |t|)\$\\
\hline
\$\textbackslash{}beta\_0\$ & -17.579 & 6.7584 & -2.601 & 0.0123\\
\hline
\$\textbackslash{}beta\_1\$ & 3.932 & 0.4155 & 9.464 & 0.0000\\
\hline
\end{tabular}
Other common special LaTeX characters include
#, %, &, {, and }. Common special HTML characters include &, <, >, and ". You need to be cautious when generating tables with escape = FALSE, and make sure you are using the special characters in the right way. It is a very common mistake to use escape = FALSE and include % or _ in column names or the caption of a LaTeX table without realizing that they are special.
If you are not sure how to properly escape special characters, there are helper functions in knitr and xfun. Below are some examples:
knitr:::escape_latex(c('100%', '# a comment', 'column_name'))
## [1] "100\\%" "\\# a comment" "column\\_name"
xfun::html_escape(c('<address>', 'x = "character"', 'a & b'))
## [1] "<address>" "x = "character"" "a & b"
Subsection 10.1.8 Multiple tables side by side
You can pass a list of data frames or matrices to
kable() to generate multiple tables side by side. For example:
d1 <- head(cars, 3)
d2 <- head(mtcars[, 1:3], 5)
knitr::kable(
  list(d1, d2),
  caption = 'Two tables placed side by side.',
  booktabs = TRUE, valign = 't'
)
Please note that this feature only works for HTML and PDF output.
If you want to be able to customize each table individually when placing them side by side, you may use the
kables() function (the plural form of kable()), and pass a list of kable() objects to it. For example, we change the column names in the left table and set the number of decimal places to zero in the right table:
# data objects d1 and d2 are from the previous code chunk
knitr::kables(
  list(
    # the first kable() to change column names
    knitr::kable(
      d1, col.names = c('SPEED', 'DISTANCE'), valign = 't'
    ),
    # the second kable() to set the digits option
    knitr::kable(d2, digits = 0, valign = 't')
  ),
  caption = 'Two tables created by knitr::kables().'
)
Subsection 10.1.9 Generate multiple tables from a for-loop
One common confusion about
kable() is that it does not work inside for-loops. The reason is that in the loop, the kable() results are not printed at the top level (for more details, see the blog post The Ghost Printer behind Top-level R Expressions). You may expect the following code chunk to generate three tables, but it will not:
```{r}
for (i in 1:3) {
  knitr::kable(head(iris))
}
```
You have to explicitly print the
kable() results, and apply the chunk option results = 'asis', e.g.,
```{r, results='asis'}
for (i in 1:3) {
  print(knitr::kable(head(iris)))
}
```
In general, when you generate output from a
for-loop, we recommend that you add a few line breaks (\n) or an HTML comment (<!-- -->) after each output element to clearly separate all output elements, e.g.,
```{r, results='asis'}
for (i in 1:3) {
  print(knitr::kable(head(iris), caption = 'A caption.'))
  cat('\n\n<!-- -->\n\n')
}
```
Without the separators, Pandoc may fail to detect the individual elements. For example, when a plot is followed immediately by a table, the table will not be recognized:

mpg cyl disp hp
------------------ ----- ---- ----- ----
Mazda RX4 21.0 6 160 110
Mazda RX4 Wag 21.0 6 160 110
But it will be if there is a clear separation like this (note that we added an empty line below the image):

mpg cyl disp hp
------------------ ----- ---- ----- ----
Mazda RX4 21.0 6 160 110
Mazda RX4 Wag 21.0 6 160 110
or

<!-- -->
mpg cyl disp hp
------------------ ----- ---- ----- ----
Mazda RX4 21.0 6 160 110
Mazda RX4 Wag 21.0 6 160 110
Subsection 10.1.10 Customize LaTeX tables
If the only output format you need is LaTeX, there are a few extra options you can use in
kable(). Note that these options will be ignored in other types of output such as HTML. Unless you have set the table format option globally (see Subsection 10.1.1), you will have to use the format argument of kable() explicitly in the examples of this section, e.g.,
knitr::kable(iris2, format = "latex", booktabs = TRUE)
When you assign a caption to a table (see Subsection 10.1.4),
kable() will use the table environment to include the table, i.e.,
\begin{table}
% the table body (usually the tabular environment)
\end{table}
You can change this environment via the
table.envir argument, e.g.,
knitr::kable(cars[1:2, ], format = "latex", table.envir = "figure")
\begin{figure}
\begin{tabular}{r|r}
\hline
speed & dist\\
\hline
4 & 2\\
\hline
4 & 10\\
\hline
\end{tabular}
\end{figure}
The floating position of the table is controlled by the argument
position. For example, we can try to force a table to float to the bottom of a page via position = "!b":
knitr::kable(cars[1:2, ], format = "latex", table.envir = "table",
  position = "!b")
\begin{table}[!b]
\begin{tabular}{r|r}
\hline
speed & dist\\
\hline
4 & 2\\
\hline
4 & 10\\
\hline
\end{tabular}
\end{table}
When a table has a caption, you can also assign a short caption to it via the
caption.short argument, e.g.,
knitr::kable(iris2, caption = "A long long long caption!",
  caption.short = "A short one.")
The short caption goes into the square brackets of the
\caption[]{} command in LaTeX, and is often used in the List of Tables of the PDF output document (if the short caption is not provided, the full caption is displayed there).
If you are familiar with the LaTeX package
booktabs for publication-quality tables, you can set booktabs = TRUE, e.g.,
iris3 <- head(iris, 10)
knitr::kable(iris3, format = "latex", booktabs = TRUE)
\begin{tabular}{rrrrl}
\toprule
Sepal.Length & Sepal.Width & Petal.Length & Petal.Width & Species\\
\midrule
5.1 & 3.5 & 1.4 & 0.2 & setosa\\
4.9 & 3.0 & 1.4 & 0.2 & setosa\\
4.7 & 3.2 & 1.3 & 0.2 & setosa\\
4.6 & 3.1 & 1.5 & 0.2 & setosa\\
5.0 & 3.6 & 1.4 & 0.2 & setosa\\
\addlinespace
5.4 & 3.9 & 1.7 & 0.4 & setosa\\
4.6 & 3.4 & 1.4 & 0.3 & setosa\\
5.0 & 3.4 & 1.5 & 0.2 & setosa\\
4.4 & 2.9 & 1.4 & 0.2 & setosa\\
4.9 & 3.1 & 1.5 & 0.1 & setosa\\
\bottomrule
\end{tabular}
Please note that when you need additional LaTeX packages such as
booktabs for an R Markdown document, you have to declare these packages in YAML (see Subsection 6.4.1 for how).
Depending on whether the argument
booktabs is TRUE or FALSE (default), the table appearance is different. For booktabs = FALSE:
-
Table columns are separated by vertical lines. You can explicitly remove the vertical lines via the
vlineargument, e.g.,knitr::kable(iris, vline = "")(the default isvline = "|"). You can set this option as a global R option so you do not need to set it for every single table, e.g.,options(knitr.table.vline = ""). -
The horizontal lines can be defined via arguments
toprule,midrule,linesep, andbottomrule. Their default values are all\hline.
For
booktabs = TRUE:
-
There are no vertical lines in the table, but you can add these lines via the
vlineargument. -
The table only has horizontal lines for the table header and the bottom row. The default argument values are
toprule = "\\toprule",midrule = "\\midrule", andbottomrule = "\\bottomrule". A line space is added to every five rows by default. This is controlled by the argumentlinesep, which defaults toc("", "", "", "", "\\addlinespace"). If you want to add a space to every three rows, you can do this:
knitr::kable(iris3, format = "latex", linesep = c("", "",
  "\\addlinespace"), booktabs = TRUE)
\begin{tabular}{rrrrl}
\toprule
Sepal.Length & Sepal.Width & Petal.Length & Petal.Width & Species\\
\midrule
5.1 & 3.5 & 1.4 & 0.2 & setosa\\
4.9 & 3.0 & 1.4 & 0.2 & setosa\\
4.7 & 3.2 & 1.3 & 0.2 & setosa\\
\addlinespace
4.6 & 3.1 & 1.5 & 0.2 & setosa\\
5.0 & 3.6 & 1.4 & 0.2 & setosa\\
5.4 & 3.9 & 1.7 & 0.4 & setosa\\
\addlinespace
4.6 & 3.4 & 1.4 & 0.3 & setosa\\
5.0 & 3.4 & 1.5 & 0.2 & setosa\\
4.4 & 2.9 & 1.4 & 0.2 & setosa\\
\addlinespace
4.9 & 3.1 & 1.5 & 0.1 & setosa\\
\bottomrule
\end{tabular}
If you want to remove the line spaces altogether, you may use
linesep = ''.
Sometimes your table may be longer than a page. In this case, you can use the argument
longtable = TRUE, which uses the LaTeX package longtable to span your table to multiple pages.
Tables are center-aligned by default when they are included in a table environment (i.e., when the table has a caption). If you do not want to center a table, use the argument
centering = FALSE.
Subsection 10.1.11 Customize HTML tables
If you want to customize tables generated via
knitr::kable(format = "html"), there is only one extra argument besides the common arguments mentioned in previous sections: table.attr. This argument allows you to add arbitrary attributes to the <table> tag. For example:
knitr::kable(mtcars[1:2, 1:2], table.attr = 'class="striped"', format = "html")
<table class="striped">
 <thead>
  <tr>
   <th style="text-align:left;">   </th>
   <th style="text-align:right;"> mpg </th>
   <th style="text-align:right;"> cyl </th>
  </tr>
 </thead>
<tbody>
  <tr>
   <td style="text-align:left;"> Mazda RX4 </td>
   <td style="text-align:right;"> 21 </td>
   <td style="text-align:right;"> 6 </td>
  </tr>
  <tr>
   <td style="text-align:left;"> Mazda RX4 Wag </td>
   <td style="text-align:right;"> 21 </td>
   <td style="text-align:right;"> 6 </td>
  </tr>
</tbody>
</table>
We added a class
striped to the table. However, a class name is not enough to change the appearance of a table. You have to define CSS rules for the class. For example, to make a striped table that has different colors for odd and even rows, you can add a light gray background to even or odd rows:
.striped tr:nth-child(even) { background: #eee; }
The above CSS rule means all rows (i.e., the
<tr> tags) with even row numbers (:nth-child(even)) that are children of an element with the striped class will have a background color #eee.
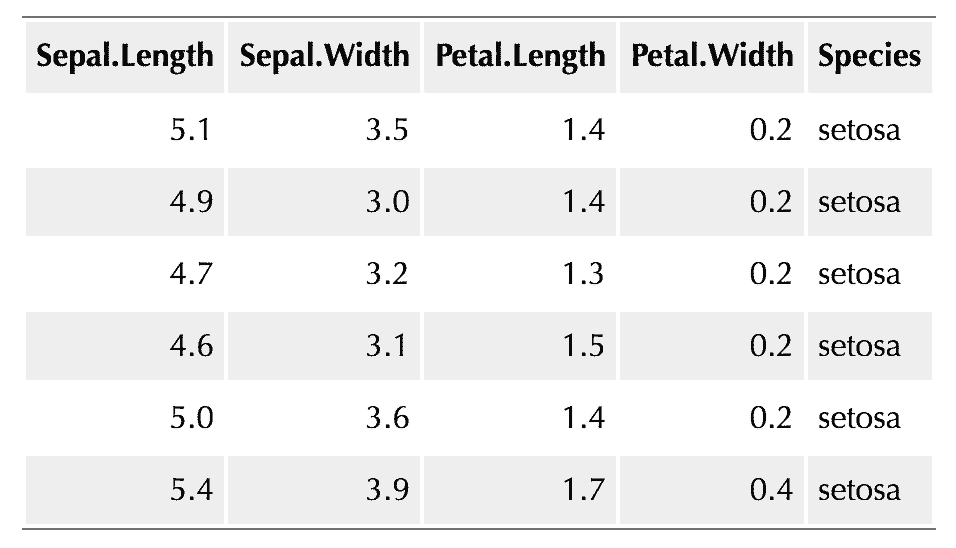
A little bit of CSS can make a plain HTML table look decent. Figure 10.1.3 is a screenshot of an HTML table to which the following CSS rules are applied:
table {
  margin: auto;
  border-top: 1px solid #666;
  border-bottom: 1px solid #666;
}
table thead th { border-bottom: 1px solid #ddd; }
th, td { padding: 5px; }
thead, tfoot, tr:nth-child(even) { background: #eee; }