Chapter 12 Regression with Qualitative Independent Variables
In this chapter, I will walk you through some analysis I conduct with an example dataset, in order to show how regression works with qualitative independent variables. I could have easily completed this analysis using the methods from Chapter 8 8, but it is important to see how regression can also be used as a method for comparing means across groups.
Let’s say I’m interested in studying how personality relates to gender. The most common model of personality in psychology is called the “Big Five.” One common measure consists of 50 survey items (the IPIP Big-Five Factor Markers), with 10 items for each of the five personality traits from the model. Figure 12.0.1 shows some of these questions and how they are formatted.
1
Goldberg, L. R. (1992). The development of markers for the Big-Five factor structure. Psychological assessment, 4(1), 26.
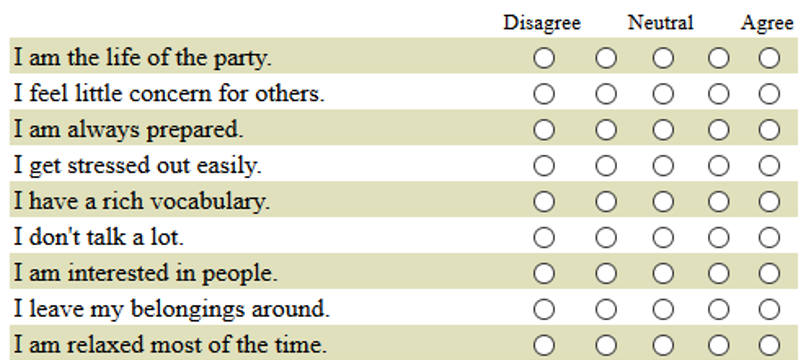
For now, I decide to focus on whether people are introverted or extroverted. Extroverts are outgoing and tend to enjoy interacting with others. Extroverts will tend to agree with the statement “I am the life of the party” while introverts will tend to agree with the item “I don’t talk a lot.”
I find a dataset that contains lots of responses to the Big Five personality questions as well as information on the gender of each respondent.
There are 10 different questions related to extroversion, and the dataset has one variable for each of these 10 questions (Figure 12.0.2). The variable labeled e1 shows responses to the item “I am the life of the party.” A value of 1 means the respondent disagrees with this statement, while a 3 indicates neutral, and a 5 means they agree.
2
https://openpsychometrics.org/_rawdata/ (the file I used is called “BIG5.zip”)
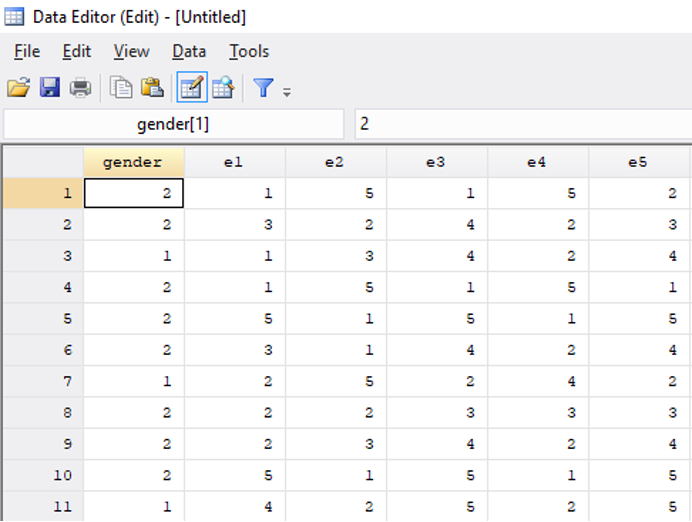
For all of the odd-numbered extroversion questions (e1, e3, e5, etc.), agreement indicates extroversion. For the even-numbered items (e2, e4, e6, etc.), agreement indicates introversion. To create a single extroversion variable that combines responses from all 10 survey items, I create a tally, adding up all the values for odd-numbered questions and then subtracting the responses to the even-numbered questions. An extreme extrovert will have a 5 for all the odd-numbered questions and a 1 for all of the even-numbered ones, giving them a score of 20 (\(5 \times 5-5 \times 1=20\)). An extreme introvert will have a -20 since they will answer 1 to all the odd-numbered questions and 5 to all the even-numbered ones (\(5 \times 1-5 \times 5=-20\)).
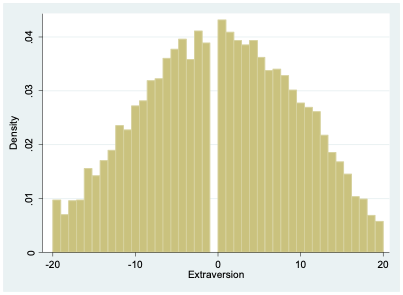
As Figure 12.0.3 indicates, most people lie somewhere in the middle between introversion and extroversion.
Our gender variable was measured by asking respondents “What is your gender?” and they could choose from male (coded as a 1), female (2), or other (3). In a moment, we’ll consider those who responded “other,” but for now, let’s just look at those who chose either male or female.

