Section 9.1 Chi Square Distribution 1
This section is adapted from David M. Lane. "Chi Square Distribution." Online Statistics Education: A Multimedia Course of Study. https://onlinestatbook.com/2/chi_square/distribution.html
1
This section is adapted from David M. Lane. "Chi Square Distribution." Online Statistics Education: A Multimedia Course of Study.
https://onlinestatbook.com/2/chi_square/distribution.html
While the details of the Chi Square distribution are not so important for understanding how to interpret a test of the relationship between two qualitative variable, a brief explanation is nonetheless provided here (with more information provided in this chapter’s appendix). A standard normal deviate is a random sample from the standard normal distribution. The Chi Square distribution is the distribution of the sum of squared standard normal deviates, and the degrees of freedom of the distribution is equal to the number of standard normal deviates being summed. Again, don’t worry if you don’t follow these details since they are not important for the average reader of this text.
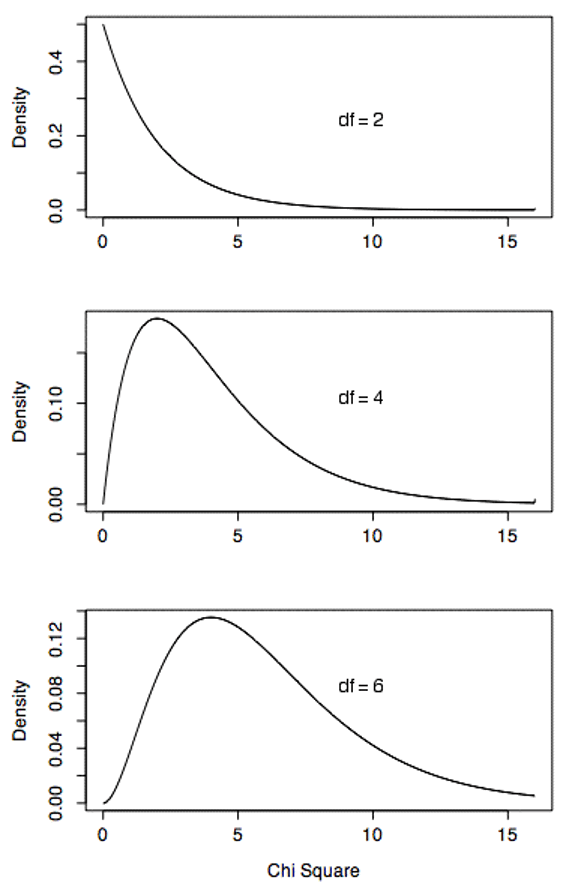
Chi Square distributions are positively skewed, but as the degrees of freedom increases, the degree of skew decreases and the Chi Square distribution approaches a normal distribution. Figure 9.1.1 shows density functions for three Chi Square distributions. Notice how the skew decreases as the degrees of freedom increases.
The Chi Square distribution is very important because many test statistics are approximately distributed as Chi Square. Two of the more common tests using the Chi Square distribution are tests of deviations of differences between theoretically expected and observed frequencies (one-way tables) and the relationship between qualitative variables (contingency tables). Numerous other tests beyond the scope of this work are based on the Chi Square distribution.

