Chapter 15 Parameterized reports
One of the many benefits of working with R Markdown is that you can reproduce analysis at the click of a button. This makes it very easy to update any work and alter any input parameters within the report. Parameterized reports extend this one step further, and allow users to specify one or more parameters to customize the analysis. This is useful if you want to create a report template that can be reused across multiple similar scenarios. Examples may include:
-
Showing results for a specific geographic location.
-
Running a report that covers a specific time period.
-
Running a single analysis multiple times for different assumptions.
-
Controlling the behavior of knitr (e.g., specify if you want the code to be displayed or not).
In this chapter, we discuss the use of parameterized reports, and explain how we can interactively define the parameters to compile the results.
Section 15.1 Declaring parameters
Parameters are specified using the
params field within the YAML section. We can specify one or more parameters with each item on a new line. As an example:
---
title: My Document
output: html_document
params:
  year: 2018
  region: Europe
  printcode: TRUE
  data: file.csv
---
All standard R types that can be parsed by
yaml::yaml.load() can be included as parameters, including character, numeric, integer, and logical types. We can also use R objects by including !r before R expressions. For example, we could include the current date with the following R code:
---
title: My Document
output: html_document
params:
  date: !r Sys.Date()
---
Any R expressions included within the parameters are executed before any code in the document, therefore any package dependencies must be explicitly stated using the
package::function notation (e.g., !r lubridate::today()), even if the package is loaded later in the Rmd document.
Section 15.2 Using parameters
You can access the parameters within the knitting environment and the R console in RStudio. The values are contained within a read-only list called
1
Parameters will not be available immediately after loading the file, but require any line of the report to be executed first.
params. In the previous example, the parameters can be accessed as follows:
params$year
params$region
Parameters can also be used to control the behavior of knitr. For example, the knitr chunk option
echo controls whether to display the program code, and we can set this option globally in a document via a parameter:
---
params:
  printcode: false  # or set it to true
---

```{r, setup, include=FALSE}
# set this option in the first code chunk in the document
knitr::opts_chunk$set(echo = params$printcode)
```
Section 15.3 Knitting with parameters
There are three ways in which a parameterized report can be knitted:
-
Using the
Knitbutton within RStudio. -
Using an interactive user interface to input parameter values.
Subsection 15.3.1 The Knit button
By using the
Knit button in RStudio or calling rmarkdown::render() function, the default values listed in the YAML metadata (if specified) will be used.
Subsection 15.3.2 Knit with custom parameters
Even if your document has the
params field in the YAML metadata, you can actually override it by providing a custom list of parameter values to the function rmarkdown::render(). For example:
rmarkdown::render("MyDocument.Rmd", params = list(
  year = 2017,
  region = "Asia",
  printcode = FALSE,
  file = "file2.csv"
))
We do not have to explicitly state all parameters in the
params argument. Any parameters not specified will default to the values specified in the YAML metadata. For example, this will only override the region parameter:
rmarkdown::render("MyDocument.Rmd", params = list(
  region = "Asia"
))
You may want to integrate these changes into a function. Such a function could also be used to create an output file with a different filename for each of the different combination of parameters. In the following example, a new file
Report-region-year.pdf is created for each set of parameters:
render_report = function(region, year) {
  rmarkdown::render(
    "MyDocument.Rmd", params = list(
      region = region,
      year = year
    ),
    output_file = paste0("Report-", region, "-", year, ".pdf")
  )
}
Subsection 15.3.3 The interactive user interface
We can use a graphical user interface (GUI) based on Shiny to interactively input the parameters of a report. The user interface can be called by either
rmarkdown::render("MyDocument.Rmd", params = "ask") or clicking the drop-down menu behind the Knit button and choosing Knit with Parameters in RStudio. Figure Figure 15.1 shows the GUI of rmarkdown asking for inputting parameters.
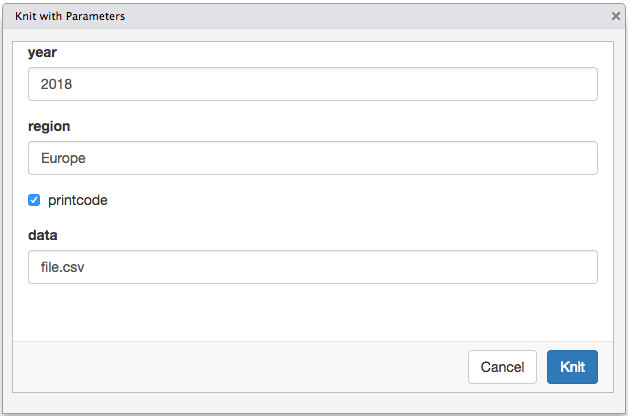
Input parameter values interactively for parameterized reports.
The input controls for different types of parameters can be customized by specifying additional sub-items within the parameter specification in YAML. For example, sliders, check boxes, and text input boxes can all be used for input controls.
In addition, we can also specify constraints of the values allowed in each parameter. For example, we may only want our model to be run for years between 2010 and 2018. This is particularly beneficial if you would like other users to interact with the report, as it prevents users from attempting to run reports outside of the designed limits.
Adapting our above example to include some settings:
---
title: My Document
output: html_document
params:
  year:
    label: "Year"
    value: 2017
    input: slider
    min: 2010
    max: 2018
    step: 1
    sep: ""
  region:
    label: "Region:"
    value: Europe
    input: select
    choices: [North America, Europe, Asia, Africa]
  printcode:
    label: "Display Code:"
    value: TRUE
  data:
    label: "Input dataset:"
    value: results.csv
    input: file
---
This results in the user interface for the parameters as shown in Figure Figure 15.2.
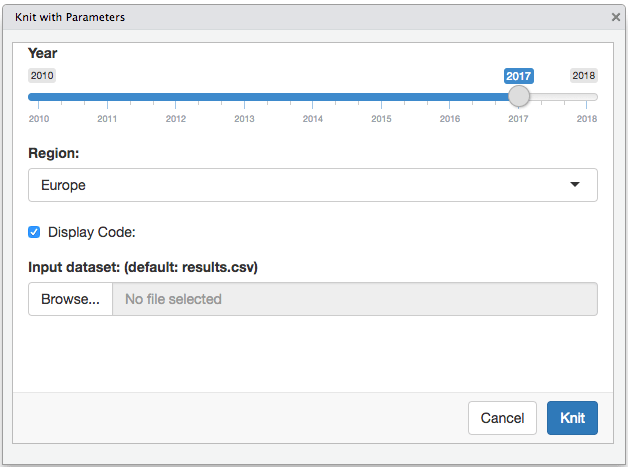
Custom controls for parameters.
The type of Shiny control used is controlled by the
input field. Table Table 15.3 shows the input types currently supported (see the help page for the associated Shiny function for additional attributes that can be specified to customize the input, e.g., ?shiny::checkboxInput).
| Input Type | Shiny Function |
|---|---|
| checkbox | checkboxInput |
| numeric | numericInput |
| slider | sliderInput |
| date | dateInput |
| text | textInput |
| file | fileInput |
| radio | radioButtons |
| select | selectInput |
| password | passwordInput |
Section 15.4 Publishing
Parameterized reports are supported by the publishing platform RStudio Connect (https://www.rstudio.com/products/connect/). If you publish a parameterized report to an RStudio Connect server, you will be able to compile reports by interactively choosing different parameter values on the server, and easily store/navigate through different reports built previously. You may watch a video demonstration at https://bit.ly/rsc-params.
