Section 4.3 Working with Vectors in R
Remember the list of ages of family members from the last chapter? No? Well, here it is again: 43, 42, 12, 8, 5, for dad, mom, sis, bro, and the dog, respectively. We mentioned that this was a list of items, all of the same mode, namely "integer." Remember that you can tell that they are OK to be integers because there are no decimal points and therefore nothing after the decimal point. We can create a vector of integers in r using the
c() command. Take a look at the screen shot just below.
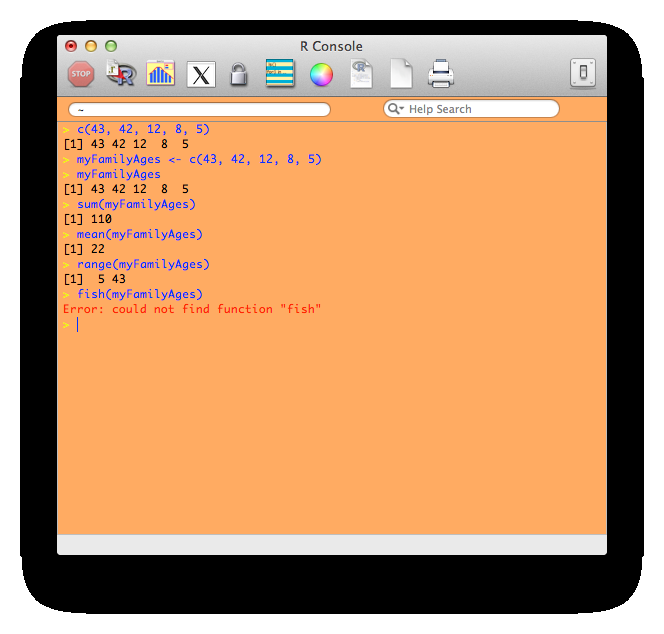
myFamilyAges vector, including sum(), mean(), range(), and an error from the undefined fish() function.This is just about the last time that the whole screenshot from the R console will appear in the book. From here on out we will just look at commands and output so we don’t waste so much space on the page. The first command line in the screen shot is exactly what appeared in the previous chapter:
c(43, 42, 12, 8, 5)
You may notice that on the following line, R dutifully reports the vector that you just typed. After the line number “[1]”, we see the list 43, 42, 12, 8, and 5. R “echoes” this list back to us, because we didn’t ask it to store the vector anywhere. In contrast, the next command line (also the same as in the previous chapter), says:
myFamilyAges <- c(43, 42, 12, 8, 5)
We have typed in the same list of numbers, but this time we have assigned it, using the left pointing arrow, into a storage area that we have named “myFamilyAges.” This time, R responds just with an empty command prompt. That’s why the third command line requests a report of what myFamilyAges contains (Look after the yellow “>”. The text in blue is what you should type.) This is a simple but very important tool. Any time you want to know what is in a data object in R, just type the name of the object and R will report it back to you.
In the next command we begin to see the power of R:
sum(myFamilyAges)
This command asks R to add together all of the numbers in
myFamilyAges, which turns out to be 110 (you can check it yourself with a calculator if you want). This is perhaps a bit of a weird thing to do with the ages of family members, but it shows how with a very short and simple command you can unleash quite a bit of processing on your data. In the next line we ask for the “mean” (what non-data people call the average) of all of the ages and this turns out to be 22 years. The command right afterwards, called “range,” shows the lowest and highest ages in the list. Finally, just for fun, we tried to issue the command fish(myFamilyAges). Pretty much as you might expect, R does not contain a fish() function and so we received an error message to that effect. This shows another important principle for working with R: You can freely try things out at anytime without fear of breaking anything. If R can’t understand what you want to accomplish, or you haven’t quite figured out how to do something, R will calmly respond with an error message and will not make any other changes until you give it a new command. The error messages from R are not always super helpful, but with some strategies that the book will discuss in future chapters you can break down the problem and figure out how to get R to do what you want.
Let’s take stock for a moment. First, you should definitely try all of the commands noted above on your own computer. You can read about the commands in this book all you want, but you will learn a lot more if you actually try things out. Second, if you try a command that is shown in these pages and it does not work for some reason, you should try to figure out why. Begin by checking your spelling and punctuation, because R is very persnickety about how commands are typed. Remember that capitalization matters in R: myFamilyAges is not the same as myfamilyages. If you verify that you have typed a command just as you see in the book and it still does not work, try to go online and look for some help. There’s lots of help at http://stackoverflow.com, at https://stat.ethz.ch, and also at http://www.statmethods.net/. If you can figure out what went wrong on your own you will probably learn something very valuable about working with R. Third, you should take a moment to experiment a bit with each new set of commands that you learn. For example, just using the commands shown in the last screen shot you could do this totally new thing:
myRange <- range(myFamilyAges)
What would happen if you did that command, and then typed
myRange (without the double quotes) on the next command line to report back what is stored there ? What would you see? Then think about how that worked and try to imagine some other experiments that you could try. The more you experiment on your own, the more you will learn. Some of the best stuff ever invented for computers was the result of just experimenting to see what was possible.
At this point, with just the few commands that you have already tried, you already know the following things about R (and about data):
-
How to install R on your computer and run it.
-
How to type commands on the R console.
-
The use of the
c()function. Remember that “c” stands for concatenate, which just means to join things together. You can put a list of items inside the parentheses, separated by commas. -
That a vector is pretty much the most basic form of data storage in R, and that it consists of a list of items of the same mode.
-
That a vector can be stored in a named location using the assignment arrow (a left pointing arrow made of a dash and a less than symbol, like this:
<-). -
That you can get a report of the data object that is in any named location just by typing that name at the command line.
-
That you can “run” a function, such as
mean(), on a vector of numbers to transform them into something else. (Themean()function calculates the average, which is one of the most basic numeric summaries there is.)
In the next chapter we will move forward a step or two by starting to work with text and by combining our list of family ages with the names of the family members and some other information about them.

