We have done a fantastic job of identifying the best studying technique out of the three in order to get the highest memory exam scores. In life, there are typically more than just two variables. What if there was another variable in this study? For instance, what if each person’s caffeine level while studying for the memory exam was also taken into consideration. Maybe caffeine level had an influence on how well they studied, and in turn impacts their memory score. And if that is taken into account, is that a better model for explaining differences in memory scores?
# Let's say we also measured caffeine intake (low vs high)
set.seed(42)
memory2 <- memory |>
  mutate(
    caffeine = rep(c("Low", "High"), times = 30))
Now that we’ve established that study method affects memory, let’s ask a new question: does caffeine level also play a role? This moves us from a one-way ANOVA (one independent variable) to a two-way ANOVA (two independent variables, or factors)
# To see the interaction between method and caffeine levels, we add a *
anova_2 <- aov(score ~ method * caffeine, data = memory2)

supernova(anova_2)
Analysis of Variance Table (Type III SS)
Model: score ~ method * caffeine

                                        SS df      MS      F   PRE     p
--------------- --------------- | -------- -- ------- ------ ----- -----
          Model (error reduced) | 2777.807  5 555.561 10.194 .4856 .0000
         method                 | 1746.636  2 873.318 16.025 .3725 .0000
       caffeine                 |   39.360  1  39.360  0.722 .0132 .3992
method:caffeine                 |  117.439  2  58.720  1.077 .0384 .3477
          Error (from model)    | 2942.885 54  54.498
--------------- --------------- | -------- -- ------- ------ ----- -----
          Total (empty model)   | 5720.691 59  96.961
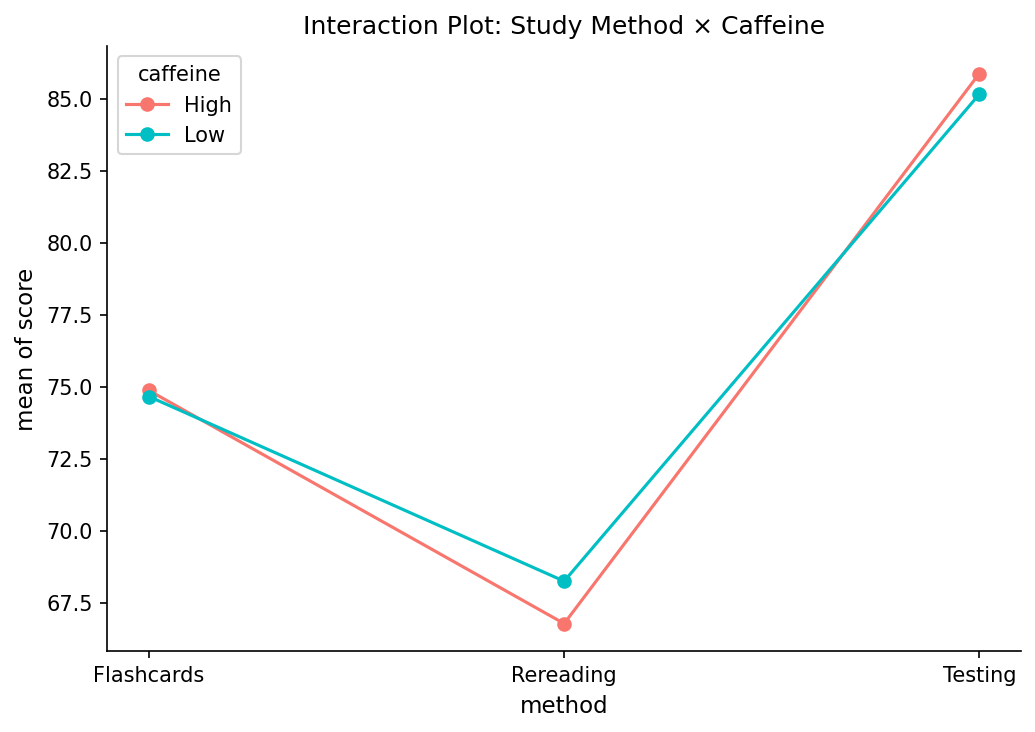
Interestingly, when we go to the p-values, we see that neither caffeine nor the interaction (how caffeine influences method) are statistically significant. This is a huge indication that caffeine does not have any impact on memory scores whatsoever. We can visualize this
ggplot(memory2, aes(x = method, y = score, color = caffeine, group = caffeine)) +
  stat_summary(fun = mean, geom = "point") +
  stat_summary(fun = mean, geom = "line") +
  labs(title = "Interaction of Study Method and Caffeine",
       x = "Study Method",
       y = "Mean Memory Score") +
  theme_minimal()
Figure5.9.1.Interaction plot between Study Method and Caffeine Level. The near-parallel lines indicate that caffeine does not significantly alter the effectiveness of different study methods.
In the graph above, we see that the lines for both high and low are nearly parallel. This gives you an indication that caffeine does not have a significant impact on study method