Section 3.3 Base R
One of the strongest qualities in R is its ability to create visualizations, powered by
ggplot2 ([D.1.8]). However, it is possible to use base R to create plots as well. It is recommended to use ggplot2; however, you may encounter base R plots in older scripts or documentation, so an example is included for familiarity.
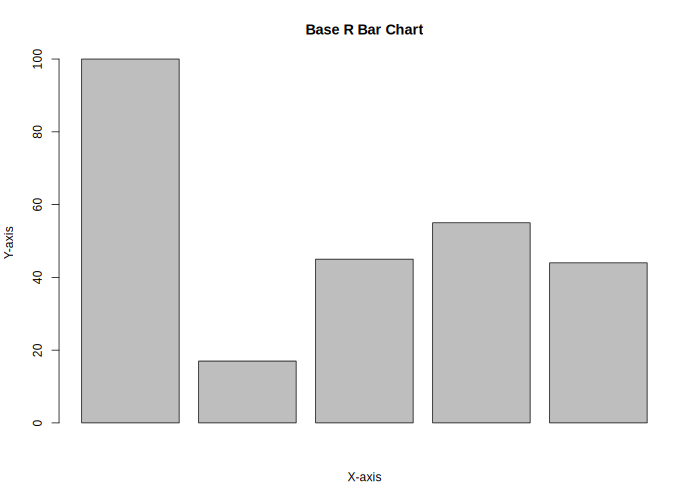
values <- c(100, 17, 45, 55, 44)

barplot(values, xlab = "X-axis", ylab = "Y-axis", main ="Base R Bar Chart")