When it comes to rbind:.
It only works when the column names in the binding datasets are the same.
rbind. The r stands for “rows” so this command is literally telling R to “bind the rows.”
nrow, and any number besides 20 means that there is an issue.
# Mets
nrow(mets) # Seeing how many rows are in mets

nrow(mets_second_ten) # Seeing how many rows are in mets_second_ten

mets_all <- rbind(mets, mets_second_ten) # Combining the rows of mets and mets_second_ten

nrow(mets_all) # Seeing how many rows are in mets_all

# Yankees
nrow(yankees)

nrow(yankees_second_ten)

yankees_all <- rbind(yankees, yankees_second_ten)
[1] 10
[1] 10
[1] 20
[1] 10
[1] 10
merge command which is part of base R. To check that our data has merged successfully, we need to make sure there are 20 rows and 3 columns: Game, Mets_Score, and Yankees_Score.
baseball_data <- merge(yankees_all, mets_all, by = "Game")

baseball_data
Game Yankees_Score Mets_Score
1     1             3          4
2     2             8         20
3     3             2         12
4     4             3          5
5     5             2          3
6     6             6          9
7     7             5          9
8     8             3         10
9     9             2          4
10   10             7          2
11   11             0         10
12   12             4          0
13   13             1          7
14   14             8          1
15   15             4          8
16   16             4          5
17   17             4          3
18   18             4          3
19   19             6          4
20   20             1          1
merge command, however, R also allows for SQL code! Here is a quick overview of the main joins using SQL in R:
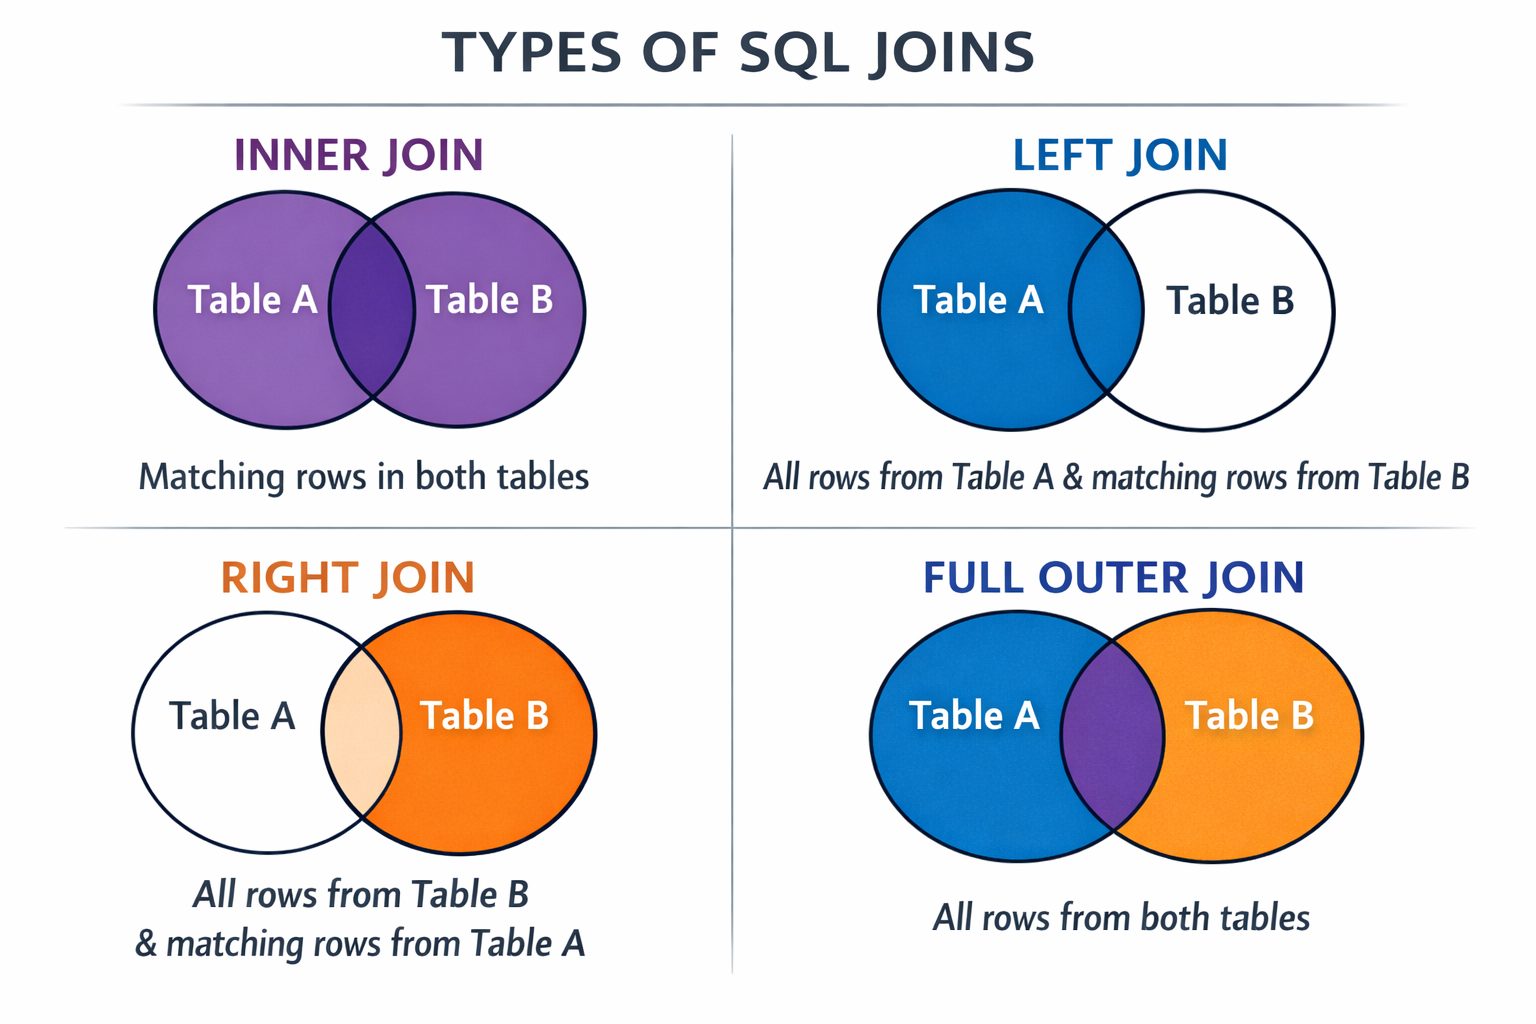
inner_join, since we know that both of our datasets have the same 20 games.
library(tidyverse)

baseball_data_sql <- inner_join(yankees_all, mets_all, by = "Game")

nrow(baseball_data_sql) # Checks the number of rows

ncol(baseball_data_sql) # Checks the number of columns

baseball_data_sql
[1] 20
[1] 3
   Game Yankees_Score Mets_Score
1     1             3          4
2     2             8         20
3     3             2         12
4     4             3          5
5     5             2          3
6     6             6          9
7     7             5          9
8     8             3         10
9     9             2          4
10   10             7          2
11   11             0         10
12   12             4          0
13   13             1          7
14   14             8          1
15   15             4          8
16   16             4          5
17   17             4          3
18   18             4          3
19   19             6          4
20   20             1          1
pivot_longer function from the tidyverse package, we can turn our data from wide to long.
# Lets say we want to turn out data from wide format into long format, so we can run
baseball_data_long <- baseball_data |> pivot_longer(cols = c(Yankees_Score, Mets_Score),
                                                    names_to = "Team",
                                                    values_to = "Score")

nrow(baseball_data_long)

baseball_data_long
[1] 40
# A tibble: 40 × 3
    Game Team          Score
   <int> <chr>         <dbl>
 1     1 Yankees_Score     3
 2     1 Mets_Score        4
 3     2 Yankees_Score     8
 4     2 Mets_Score       20
 5     3 Yankees_Score     2
 6     3 Mets_Score       12
 7     4 Yankees_Score     3
 8     4 Mets_Score        5
 9     5 Yankees_Score     2
10     5 Mets_Score        3
# ℹ 30 more rows
# Lets say we want to turn out data from wide format into long format, so we can run
baseball_data_wide <- baseball_data_long |> pivot_wider(names_from = "Team",
                                                    values_from = "Score")
nrow(baseball_data_wide)

baseball_data_wide
[1] 20
# A tibble: 20 × 3
    Game Yankees_Score Mets_Score
   <int>         <dbl>      <dbl>
 1     1             3          4
 2     2             8         20
 3     3             2         12
 4     4             3          5
 5     5             2          3
 6     6             6          9
 7     7             5          9
 8     8             3         10
 9     9             2          4
10    10             7          2
11    11             0         10
12    12             4          0
13    13             1          7
14    14             8          1
15    15             4          8
16    16             4          5
17    17             4          3
18    18             4          3
19    19             6          4
20    20             1          1

