Three sequences of data were saved in 3
R objects named “x1”, “x2” and “x3”, respectively. The application of the function “summary” to each of these objects is presented below:
> summary(x1)
   Min. 1st Qu.  Median    Mean 3rd Qu.    Max.
  0.000   2.498   3.218   3.081   3.840   4.871
> summary(x2)
     Min.   1st Qu.    Median      Mean   3rd Qu.      Max.
0.0001083 0.5772000 1.5070000 1.8420000 2.9050000 4.9880000
> summary(x3)
   Min. 1st Qu.  Median    Mean 3rd Qu.    Max.
  2.200   3.391   4.020   4.077   4.690   6.414
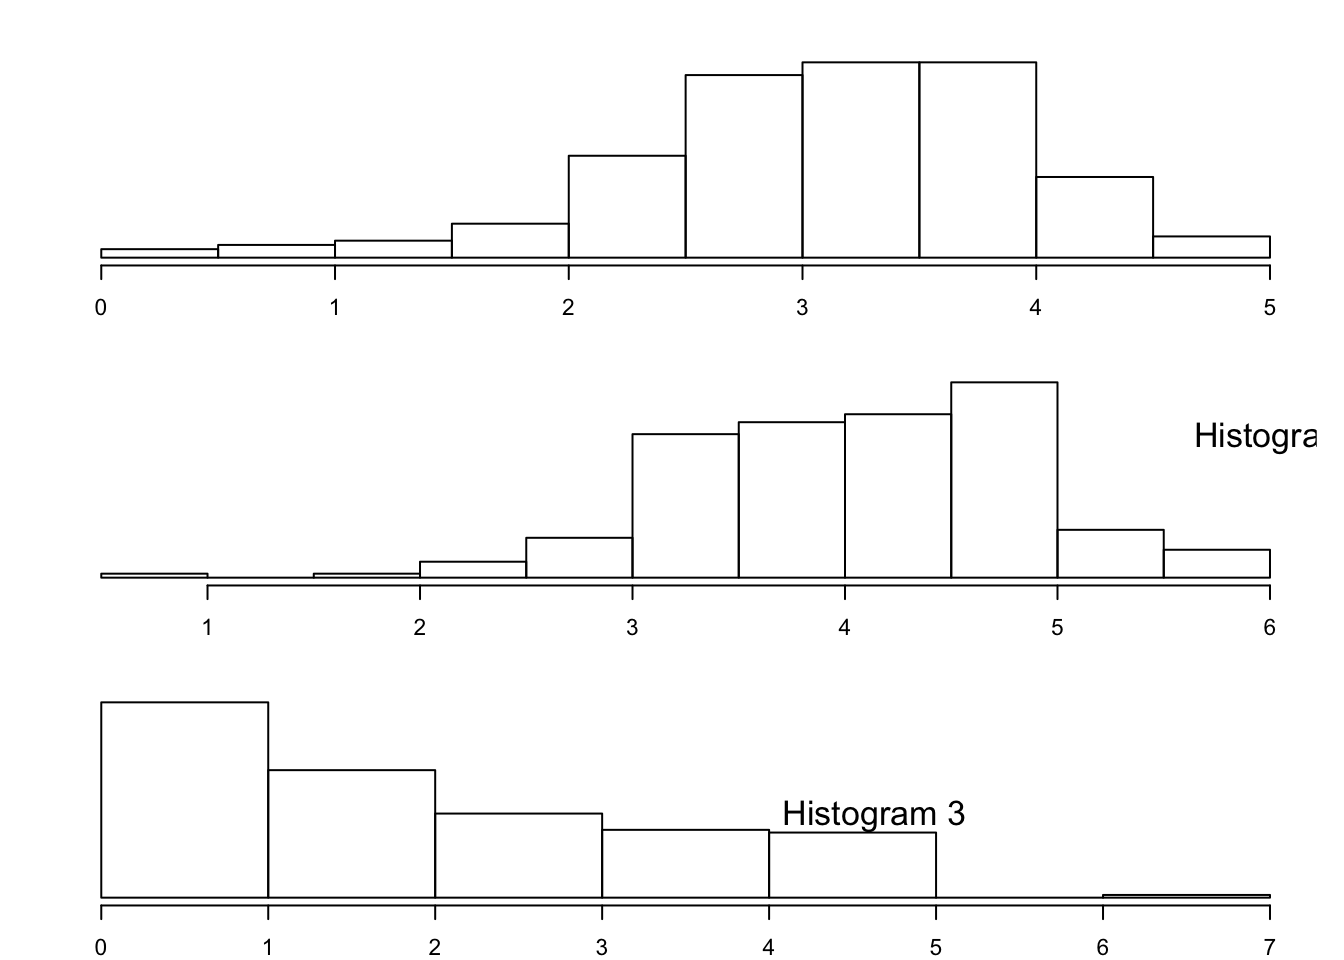
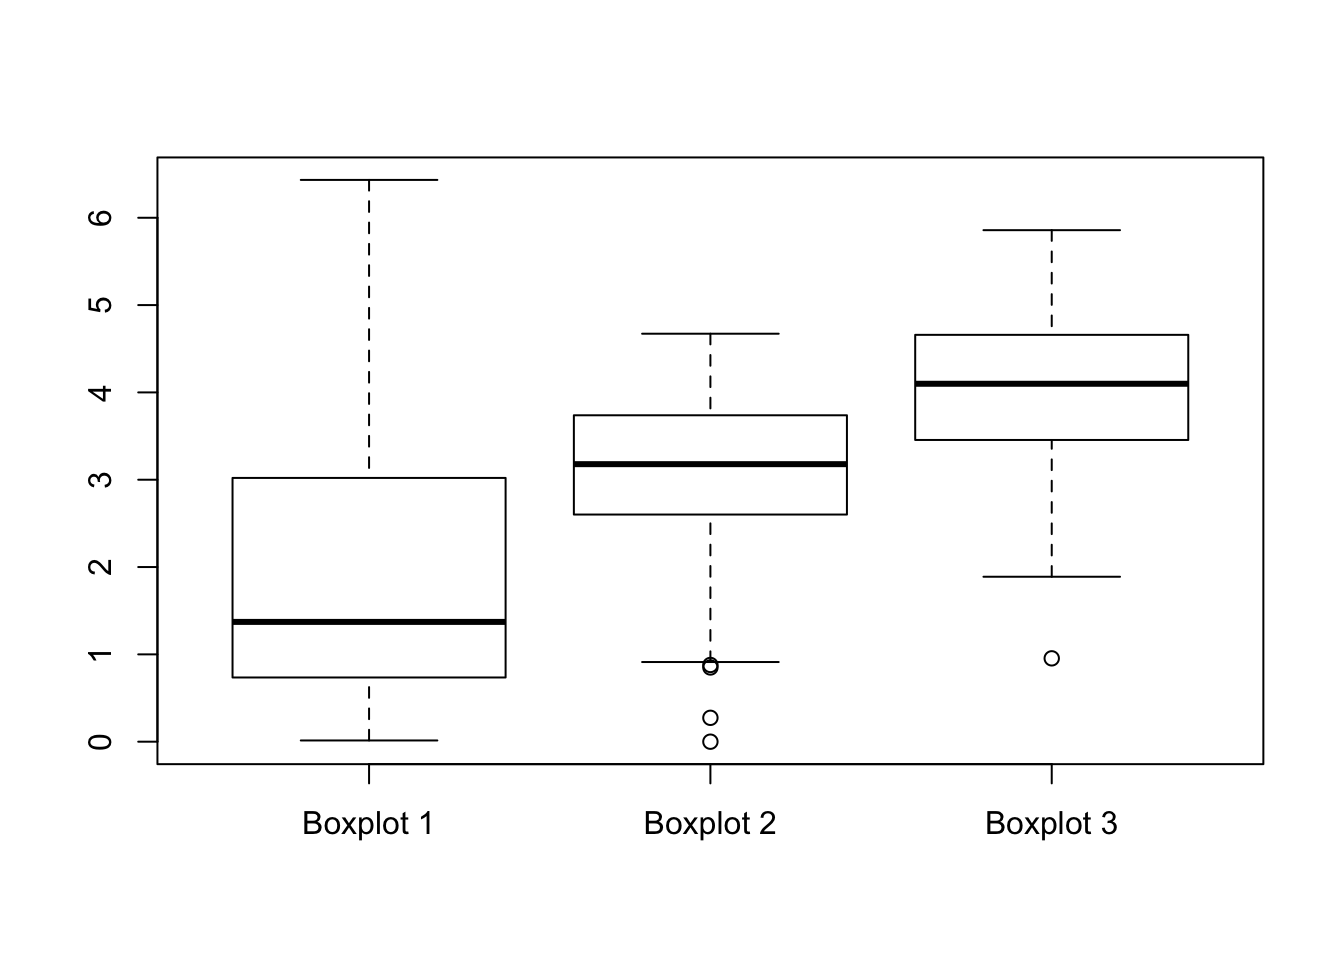
In Figure 3.5.2 one may find the histograms of these three data sequences, given in a random order. In Figure 3.5.3 one may find the box plots of the same data, given in yet a different order.
-
Match the summary result with the appropriate histogram and the appropriate box plot.
-
Is the value 0.000 in the sequence “
x1” an outlier? -
Is the value 6.414 in the sequence “
x3” an outlier?

