Section 1.3 Statistics
The science of statistics deals with the collection, analysis, interpretation, and presentation of data. We see and use data in our everyday lives. To be able to use data correctly is essential to many professions and is in your own best self-interest.
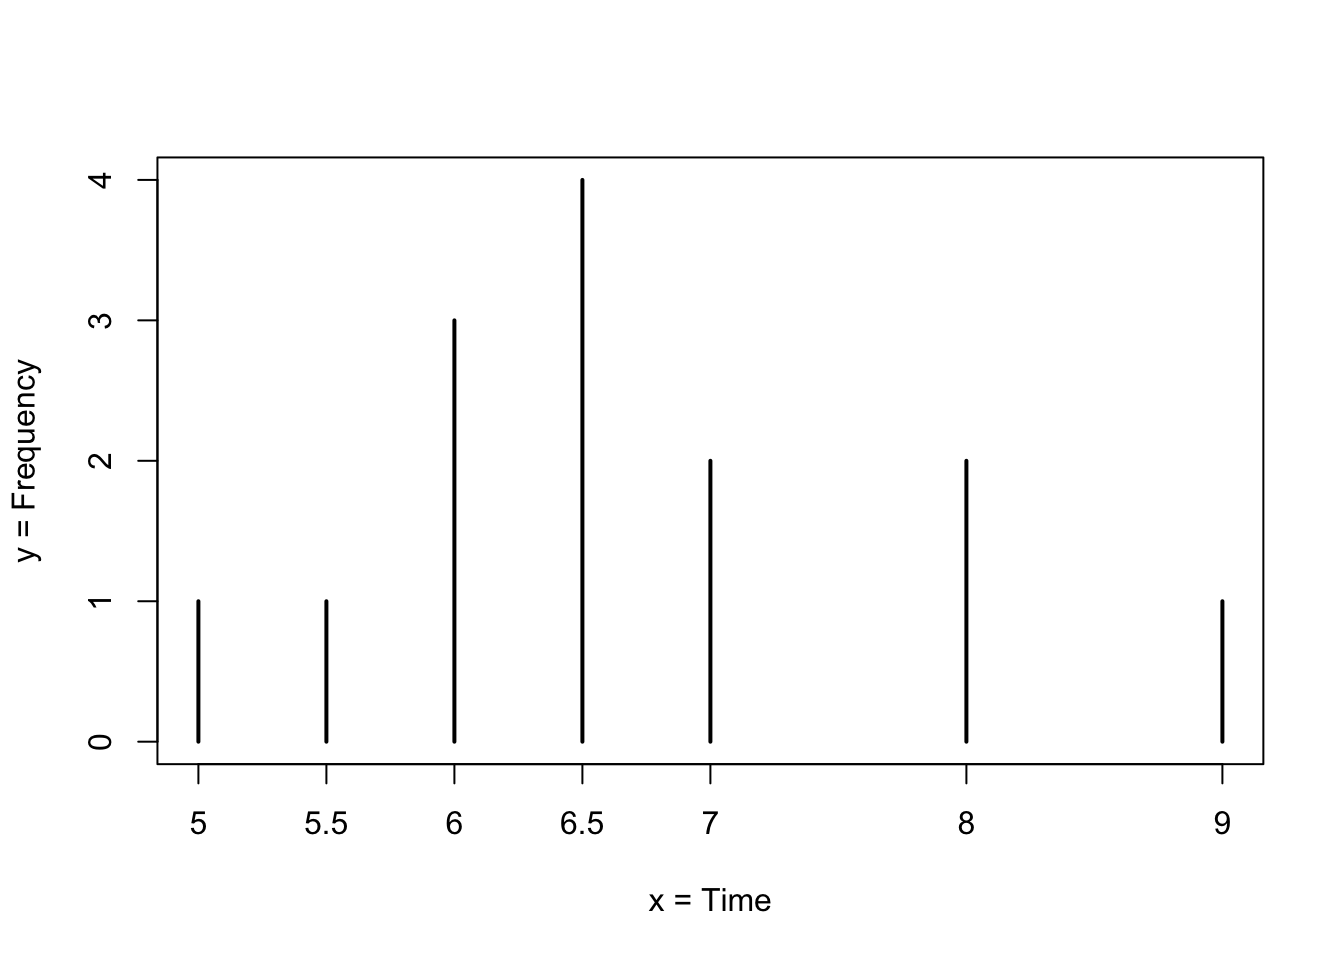
For example, assume the average time (in hours, to the nearest half-hour) a group of people sleep per night has been recorded. Consider the following data:
\begin{equation*}
5,\; 5.5,\; 6,\; 6,\; 6,\; 6.5,\; 6.5,\; 6.5,\; 6.5,\; 7,\; 7,\; 8,\; 8,\; 9
\end{equation*}
In Figure 1.3.1 this data is presented in a graphical form (called a bar plot). A bar plot consists of a number axis (the \(x\)-axis) and bars (vertical lines) positioned above the number axis. The length of each bar corresponds to the number of data points that obtain the given numerical value. In the given plot the frequency of average time (in hours) spent sleeping per night is presented with hours of sleep on the horizontal \(x\)-axis and frequency on vertical \(y\)-axis.
Think of the following questions:
-
Would the bar plot constructed from data collected from a different group of people look the same as or different from the example? Why?
-
If one would have carried the same example in a different group with the same size and age as the one used for the example, do you think the results would be the same? Why or why not?
-
Where does the data appear to cluster? How could you interpret the clustering?
The questions above ask you to analyze and interpret your data. With this example, you have begun your study of statistics.
In this course, you will learn how to organize and summarize data. Organizing and summarizing data is called descriptive statistics. Two ways to summarize data are by graphing and by numbers (for example, finding an average). In the second part of the book you will also learn how to use formal methods for drawing conclusions from “good” data. The formal methods are called inferential statistics. Statistical inference uses probabilistic concepts to determine if conclusions drawn are reliable or not.
Effective interpretation of data is based on good procedures for producing data and thoughtful examination of the data. In the process of learning how to interpret data you will probably encounter what may seem to be too many mathematical formulae that describe these procedures. However, you should always remember that the goal of statistics is not to perform numerous calculations using the formulae, but to gain an understanding of your data. The calculations can be done using a calculator or a computer. The understanding must come from you. If you can thoroughly grasp the basics of statistics, you can be more confident in the decisions you make in life.

