So far, you have learnt to ask an RQ, design a study, and describe and summarise the data. In this chapter, you will learn about probability to describe the random nature of sample statistics. You will learn to:
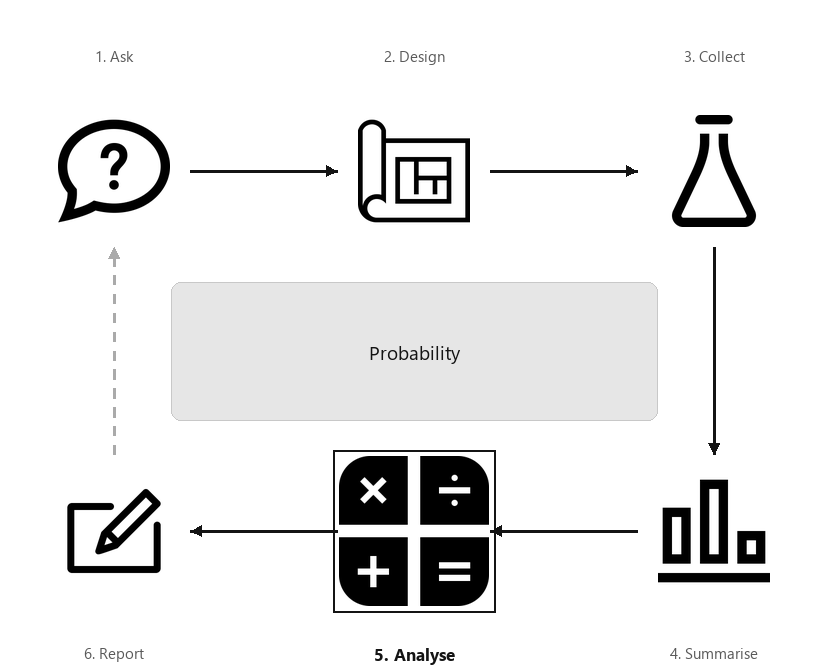
A diagram showing the six steps of research, arranged in a cycle: Ask, Design, Collect, Classify and summarise, Analyse, Report. Step 5 (Analyse) is highlighted, captioned “Probability”.
This chapter briefly discusses probability. Probability quantifies the chance of observing a specific, unknown result (an ’event’). Before discussing probability, some associated terms need defining.
A random procedure is a sequence of well-defined steps that (a) can be repeated, in theory, indefinitely under essentially identical conditions; (b) has well-defined results; and (c) where results are unpredictable for any individual repetition.
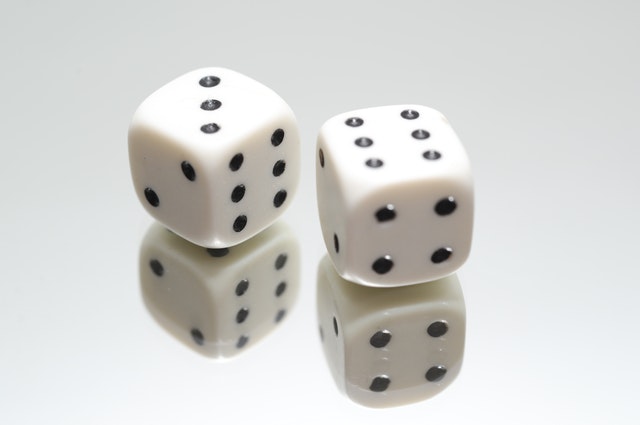
Using this definition, the result of rolling a die is a ’random procedure’, with possible results ⚀, ⚁, ⚂, ⚃, ⚄ and ⚅. Similarly, tossing a coin is a random procedure with two possible results: Heads (H) or Tails (T).
A list of all mutually exclusive possible results from one instance of a random procedure is the sample space. A simple event is any element of the sample space.
However, the sample space for this procedure can be listed: ⚀, ⚁, ⚂, ⚃, ⚄ and ⚅. These are all mutually exclusive (or distinct) results and cover all possible results (exhaustive) from a single roll. The sample space is discrete (see Sect. Section 10.2).
Consider the distance you can throw a baseball (the random procedure). We do not know beforehand what distance your next throw will be, but the sample space (i.e., the throwing distance) is a number greater than \(0\text{.}\) This sample space is continuous.
Events are often defined using and, or, not. Consider two events called \(A\) and \(B\text{.}\) Then, ’\(A\)and\(B\)’ is the event comprising events only occurring in both events \(A\) and \(B\text{.}\) ’\(A\)or\(B\)’ is the event comprising all events in \(A\text{,}\) all events in \(B\text{,}\) and events in both. The event ’not\(A\)’ comprises all the events in the sample space that are not in Event \(A\text{.}\)
Then, the Event ’\(A\)and\(B\)’ includes all events only occurring in both \(A\) and in \(B\text{;}\) that is, ’\(A\)and\(B\)’ comprises the single simple event roll a ⚅.
Event ’\(A\)or\(B\)’ include the events in \(A\text{,}\) the events in \(B\text{,}\) and those in both; that is, ’\(A\)or\(B\)’ comprises the four simple events roll a ⚁, roll a ⚂, roll a ⚃ and roll a ⚅.
A probability is a number between \(0\) and \(1\) inclusive (or between \(0\)% and \(100\)% inclusive) that quantifies the likelihood that a certain event will occur.
A probability of \(0\) (or \(0\)%) means the event is ’impossible’ (will never occur), and a probability of \(1\) (or \(100\)%) means that the event is certain to happen (will always occur). Most events have a probability between the extremes of \(0\)% and \(100\)%.
What is the probability of rolling a ⚃ on a die? The sample space has six possible outcomes (see Example Example 18.4) that are equally likely to occur (i.e., no reason exists to expect one event to occur more often than the others), and the event ’rolling a ⚃’ comprises just one of those events. Thus,
\begin{equation*}
\text{Probability of rolling a 4} = \frac{\text{The number of rolls that are a 4}}{\text{The number of possible events in the sample space}} = \frac{1}{6}.
\end{equation*}
This approach to computing probabilities is called the classical approach to probability, and is only appropriate when all events in the sample space are equally likely.
Definition18.11.Classical approach to probability.
In the classical approach to probability, the probability of an event occurring is the number of elements of the sample space included in the event, divided by the total number of elements in the sample space, when all outcomes are equally likely.
\begin{equation*}
\text{Prob. of an event} = \frac{\text{Number of simple events in the event of interest}}{\text{Total number of possible equally-likely events}}.
\end{equation*}
We can say that ’the probability of rolling a ⚃ is \(1/6\)’, or ’the probability of rolling a ⚃ is \(0.1667\)’. The answer can also be expressed as a percentage: ’the probability of rolling a ⚃ is \(16.67\)%’. The answer could also be interpreted as ’the expected proportion of rolls that are a ⚃ is \(0.1667\)’. That is, about \(16.67\)% of a very large number of future rolls are likely to be a ⚃.
The probability of rolling a ⚃ is \(0.1667\text{,}\) but any single roll of the die either will or will not produce a ⚃, and we don’t know which will occur.
Consider rolling a standard six-sided die. With six equally-likely results (Example Example 18.4), the probability of rolling an even number is \(3/6\text{,}\) since there are three even numbers in the sample space.
What is the probability that a newborn baby will be male? The sample space could be listed as: male and non-male. Since the sample space has two elements, the classical approach suggests the probability is \(1\div2 = 0.5\text{.}\) However, this approach is appropriate only if males and non-males are equally likely to be born. But are they?
In 2021 in Australia, \(289\,603\) live births occurred, with \(148\,636\) male births, \(140\,944\) female births, and \(23\) others (or ’not stated’). The proportion of males born in the 2021 sample is \(148\,636 \div 289\,603 = 0.513\text{,}\) or about \(51.3\)%. An estimate of the probability that the next birth will be male is about \(0.513\) (or \(51.3\)%), based on using past data.
This is the relative frequency approach to calculating probabilities: based on past data. The relative frequency method can only ever produce an approximate probability, as it is based on a limited number of past observations. An actual probability would require an infinite number of observations.
Definition18.15.Relative frequency approach to probability.
In the relative frequency approach to probability, the probability of an event is approximately the number of times the outcomes of interest has appeared in the past, divided by the number of ’attempts’ in the past. This produces an approximate probability.
Based on the earlier information, the odds that a new baby will be a boy is approximately\(0.513 \div (1 - 0.513) = 1.053\) (i.e., \(105.3\) boys per \(100\) girls). According to the Australian Bureau of Statistics (ABS):
Probabilities describe the likelihood that an event will occur before the result is known. Odds and proportions can be used either before or after the result is known, provided the wording is correct.
For example, proportions describe how often an event has occurred after the result is known, and expected proportions describe the likelihood that an event will occur in many repetitions before the result is known.
Many probabilities cannot be computed using the classical or relative frequency approach; for example, what is the probability that your sporting team wins their next game? It may depend on how important you deem the injuries to key players, whether you think recent form is crucial, or if you believe in a substantial home ground advantage. In this case, only a subjective probability can be given.
’Subjective’ probabilities may be based on personal judgement or experience. They can also be given by considering some of the relevant issues that may impact the probability (and may, for example, be based on mathematical models that incorporate information from numerous inputs). Depending on how these other issues are considered and combined, different subjective probabilities may be given.
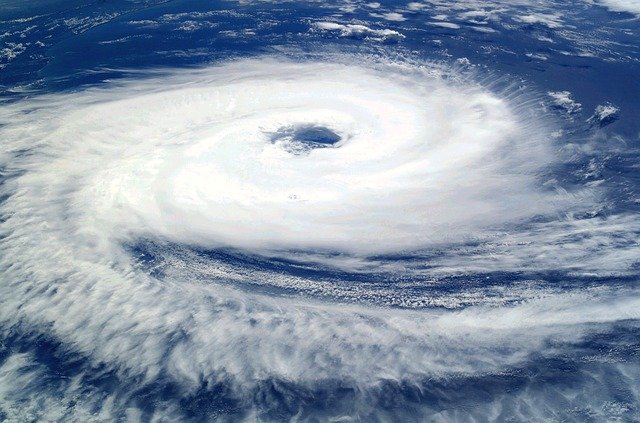
Weather forecasts are one example: they incorporate data from sea surface temperatures, local topography, air pressures, air temperatures and so on. Different models use different inputs, and may combine these inputs differently to produce different (subjective) forecast probabilities. Subjective probabilities are deductive probabilities (based on reasoning).
During El Niño events, eastern Australia typically experiences drier-than-average winters and springs. The Australian Broadcasting Corporation’s news website reported (on 23 May 2023) that the Australian Bureau of Meteorology predicted a \(50\)% probability of an El Niño event in 2023, while the American National Oceanic and Atmospheric Administration predicted a \(90\)% chance of an El Niño event in 2023.
Despite this, ’[both] agencies are looking at the same part of the Pacific Ocean’ to make their predictions. However, ’the US and Australia base their probability on different criteria’. The probabilities are subjective probabilities, based on complex mathematical models.
One important concept in probability is independence. Two events are independent if the probability of one event happening is the same, whether or not the other event has happened. For example, the probability of getting a H on a coin toss is the same whether you are sitting or not sitting: the result of the coin toss is independent of whether you are seated.
Consider drawing two cards from a well-shuffled, standard pack (of \(52\) cards), without returning the first card. For the first card, the sample space contains every card in the pack, and drawing any card is as equally likely as drawing any other. Since four cards are Aces, the probability of drawing an Ace on the first draw is \(4/52\) (using the classical approach).
If we drew an Ace for the first card, the probability of drawing an Ace for the second card is \(3/51\) (threeAces remain among the \(51\) remaining cards). Alternatively, if we don’t draw an Ace for the first card, the probability of drawing an Ace second time is \(4/51\) (fourAces remain among the \(51\) remaining cards).
That is, the probability of drawing an Ace for the second card depends on whether an Ace was drawn for the first card. The two events ’Drawing an Ace for the first card’ and ’Drawing an Ace for the second card’ are not independent events.
A ’standard’ pack of cards has \(52\) cards, organised into four suits: spades \(\spadesuit\text{,}\) clubs \(\clubsuit\) (both black), hearts \(\heartsuit\) and diamonds \(\diamondsuit\) (both red). Each suit has \(13\)denominations: \(2\text{,}\)\(3\text{,}\)\(4\text{,}\)\(5\text{,}\)\(6\text{,}\)\(7\text{,}\)\(8\text{,}\)\(9\text{,}\)\(10\text{,}\) Jack (J), Queen (Q), King (K), Ace (A). The Ace, King, Queen and Jack cards are called picture cards. (Most packs also contain two jokers, which are not considered part of a standard pack.)
Conditional probability refers to adjusting probabilities when extra information is known. For example, the probability of rolling a ⚀ is \(1/6\) using the classical approach, as the sample space has six equally-likely elements. However, if we are told that an odd number is rolled, only three elements in the sample space need now be considered (rolls of ⚀, ⚂, ⚄ rather than all six elements; other outcomes are impossible). So, the probability of rolling a ⚀ is \(1/3\text{.}\) We say ’the probability of rolling a ⚀, given that the roll is an odd number, is \(1/3\)’.
However, if you are told that the card is a black card, then the card must be either a \(\clubsuit\) or \(\spadesuit\text{.}\) The probability that the card is a \(\clubsuit\text{,}\)given that the card is black, is \(13/26 = 1/2\text{,}\) or \(50\)%.
[166] recorded the number of people at the foot of the Goodwill Bridge, Brisbane, who wore sunglasses between \(11\text{:}\)\(30\)am to \(12\text{:}\)\(30\)pm (Table Table 18.27). The probability of an observed person wearing sunglasses is
If the two events were independent, then these two conditional probabilities would be the same: the probability of wearing sunglasses would be the same for females and males. In other words, the probability of wearing sunglasses did not depend on whether a female or a male was observed. We might say that wearing sunglasses is close to, but not exactly, independent of the sex of the person, in the sample. We cannot be sure if wearing sunglasses is independent of the sex of the person in the population.
A probability is a number between \(0\) and \(1\) inclusive (or between \(0\)% and \(100\)% inclusive) that quantifies the likelihood of a certain event occurring. Three ways to think about probabilities are:
Two events are independent if the probability of one event is the same, whether the other event has happened or not. Conditional probability incorporates extra information when the probability is computed.
Suppose Event \(A\) is defined as ’Rolling a ⚀ or a ⚁ on a fair die’. Also, suppose Event \(B\) is defined as ’Rolling an even number’. Are the following statements true or false?
Consider drawing cards from a fair pack. Event A is ’drawing a picture card’, Event B is ’drawing a King or Ace’ and Event C is ’drawing a \(\spadesuit\)’.
Consider these three events about tossing two fair coins, say Coin A and Coin B: Event 1 is ’toss a H on Coin A’; Event 2 is ’toss a T on Coin A’; and Event 3 is ’toss a H on Coin B’.
Consider these three events about drawing one card from a fair pack: Event 1 is ’draw a Jack’; Event 2 is ’draw a \(\heartsuit\)’; and Event 3 is ’draw a \(\clubsuit\)’.
Suppose I draw one card from the pack (drawing the second without replacing the first), then roll a six-sided die. Are the events ’Draw a Jack from the pack of cards’ and ’Roll a ⚄ on the die’ independent events? Explain.
Consider drawing a card from a standard, well-shuffled pack of cards. The first card is replaced, the pack reshuffled, and then a second card is drawn from the pack. The colour of the two cards is recorded (Black or Red).
[132] recorded whether Iranian children aged \(6\)–\(18\) years ate breakfast (Table Table 18.29). Find the probability that a randomly chosen student is:
A certain test has a sensitivity of \(0.99\) and a specificity of \(0.98\text{.}\) Consider a group of \(1\,000\) people, \(100\) of whom (unknowingly) have the disease and \(900\) who (unknowingly) do not have the disease. All the people are given the test.
When I toss two coins, there are only three outcomes: a Head and a Head, a Tail and a Tail, or one of each. So the probability of obtaining two Tails must be one-third.
On 13 October, 1997, the American television programme Nightline interviewed Dr Richard Andrews, director of California’s Office of Emergency Services, to discussed natural disasters being predicted. In the interview, Dr Andrews said:
I listen to earth scientists talk about earthquake probabilities a lot and in my mind every probability is \(50\)–\(50\text{:}\) either it will happen or it won’t happen.