You have learnt to ask an RQ, design a study, classify and summarise the data, construct confidence intervals, and conduct hypothesis tests. In this chapter, you will learn to:
estimate the sample size for producing a CI of given width for a proportion, mean, mean difference, difference between two means, and difference between two proportions.
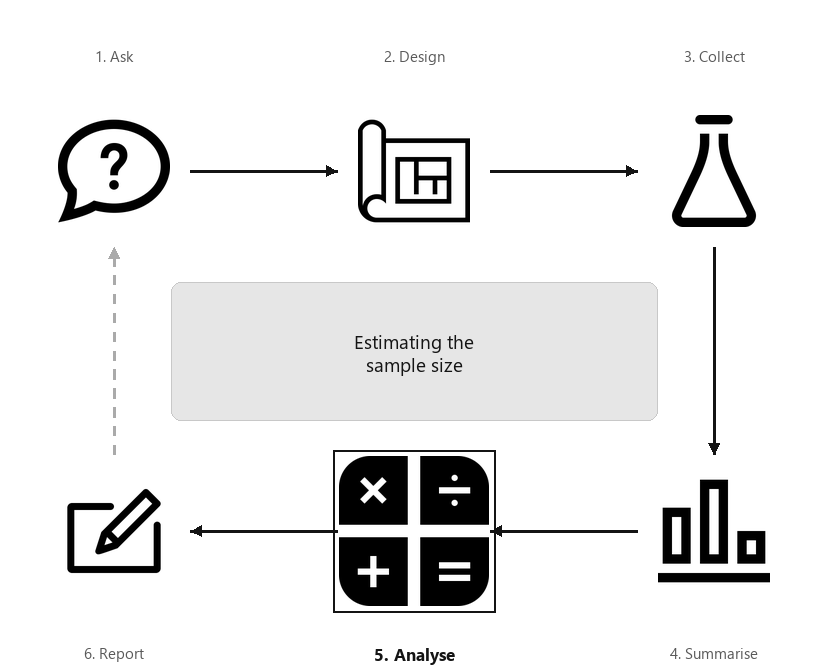
A diagram showing the six steps of research, arranged in a cycle: Ask, Design, Collect, Classify and summarise, Analyse, Report. Step 5 (Analyse) is highlighted, captioned “Estimating the sample size”.
A confidence interval (CI) is an interval which gives a range of values of the parameter that could plausibly have produced the observed value of the statistic. All else being equal, a larger sample size gives a more precise estimate of the parameter (Sect. Section 6.3); that is, a narrower CI. After all, that’s why larger samples are preferred over smaller samples: they provide more precise estimates.
Suppose we wish to estimate an unknown proportion, and find that \(\hat{p} = 0.52\) from a sample of size \(n = 25\text{.}\) The approximate \(95\)% CI is \(0.52 \pm 0.200\) (so the margin of error is \(0.200\)).
If the estimate of \(\hat{p} = 0.52\) was found from a sample of size \(n = 100\) (rather than \(n = 25\)), a more precise estimate should be expected. The approximate \(95\)% CI is \(0.52 \pm 0.100\text{;}\) the margin of error is \(0.100\text{,}\) so the estimate is indeed more precise.
If the estimate of \(\hat{p} = 0.52\) was found from a sample of size \(n = 400\text{,}\) the approximate \(95\)% CI is \(0.52 \pm 0.050\text{;}\) the margin of error is \(0.050\) (which is more precise again).
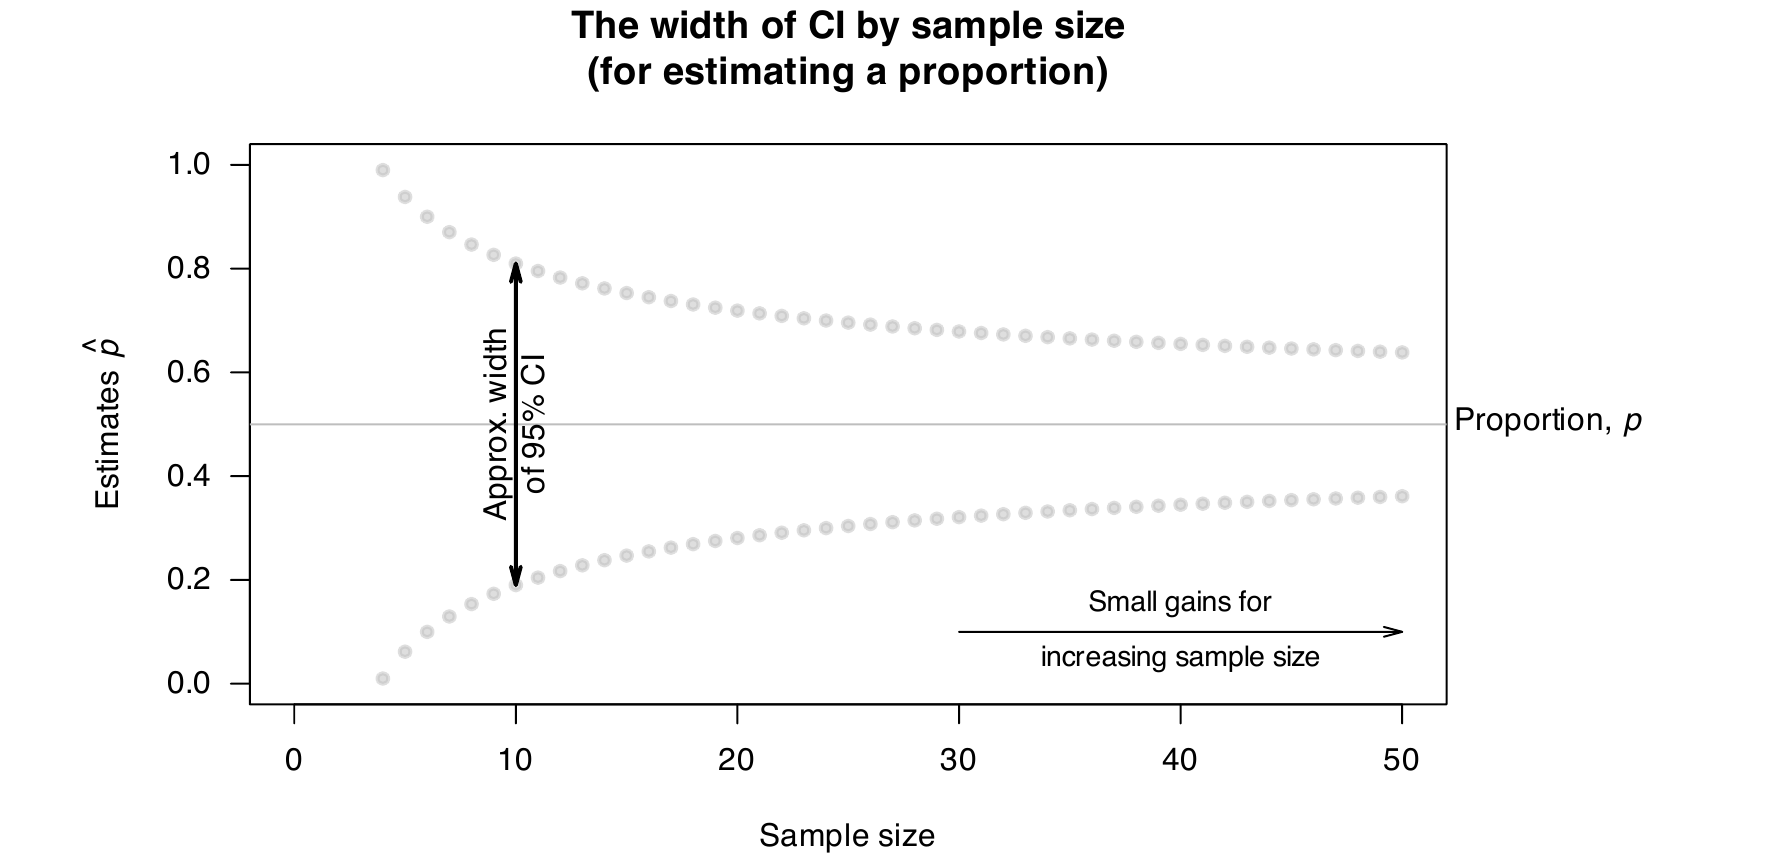
The approximate width of the CI changes for various sample sizes (all else being equal). Try changing the sample size in the interaction below (Fig. Figure 32.2). Observe that:
An interactive plot showing the approximate 95% confidence interval width shrinking as the sample size, \(n\text{,}\) increases, with a slider to change the sample size from 5 to 50.
A plot of sample size (horizontal axis, from 0 to 50) against the estimated proportion (vertical axis, from 0 to 1), showing two curves bounding the approximate 95% CI width around a proportion of 0.5: the CI is wide for small sample sizes and narrows quickly at first, then only slightly for sample sizes above about 30.
That is, improving precision gets more difficult as sample sizes get larger: large gains in precision are made by moderately increasing small sample sizes, but only small gains in precision are made by large increases in already-large sample sizes.
If larger samples give more precise estimates, should the largest sample possible always be used? Not necessarily; using large samples also has disadvantages:
[253] studied the residual effect of organic biochar compound fertilisers (BCFs) two years after application. This study required planting turmeric in pots using soil previously treated with BCFs.
After the turmeric was grown, the concentration of potassium, phosphorus and nitrogen—as well as many trace minerals—was determined from the soil in every pot. In addition, every turmeric plant was analysed for the number of shoots, the leaf mass fraction, and foliar nutrient information.
Every pot that is used has a substantial cost, both in terms of time and money. Using more pots increases precision, but also increases costs and the time to complete the study.
Determining the sample size to use in a study is a trade-off between the advantages of increasing precision, and the challenges of cost, time, and remaining ethical (Chap. Chapter 5). In addition, how the sample is obtained is important: random samples give more accurate samples (Sect. Section 6.3) than non-random samples. That is, the sample size is not the only issue to consider; how the sample is obtained (i.e., random; non-random) is also important.
For these reasons, researchers usually identify a margin of error that is meaningful (i.e., of practical importance) in the context of their study, to help identify an appropruarte sample size.
Example32.6.Practical importance in sample size calculations.
In a weight-loss study, estimating the weight loss with a precision of \(1\gs\) is far more precise than is necessary: a weight loss of \(1\gs\) has no practical importance, but would require a massive sample size to detect.
In contrast, the sample size needed to detect a mean weight loss with a precision of \(50\kgs\) would be far smaller. However, a weight loss so great is of no practical importance either, as most people who are looking to lose weight are hoping to lose far less than \(50\kgs\text{.}\)
The researchers may decide that a weight loss of \(5\kgs\) is sufficient to be of practical importance, and determine the sample size based on this value.
In this chapter, we learn how to compute the (approximate) minimum sample size needed to obtain a given precision (i.e., for a given margin of error) for a \(95\)% CI. The estimation of sample sizes for constructing a CI is studied for these situations:
The formulas given in this chapter only apply for forming \(95\)% CIs, and are very conservative: they will probably give minimum samples sizes that are a little too large, but that is better than being too small.
To ensure that the required targets are met, the results from the sample size calculation should always be rounded up. In addition, sample sizes slightly larger than calculated are often used, to allow for drop-outs: animals or plants that die; people who can no longer be contacted; and so on.
Section32.3Sample size for estimating one proportion
In Sect. Section 22.8, a CI was formed for the population proportion of female college students in the United States that drink coffee daily [225]. From a sample of \(n = 360\text{,}\) the CI was \(0.1694 \pm 0.0395\) (i.e., the margin of error is \(0.0395\)), or from \(0.130\) to \(0.209\text{.}\)
To obtain a more precise estimate (i.e., a narrower CI), a larger sample is needed, but how much larger? For instance, suppose we would like a CI with margin of error of \(0.02\) (rather than \(0.0395\)). What size sample is needed?
For the coffee-drinking situation above, at least \(1 \div (0.02^2) = 2 500\) female college students in the US is needed. This is a substantial increase from the original sample size of \(360\text{.}\)
\begin{equation*}
\frac{1}{(\text{Margin of error})^2} { = \frac{1}{0.07^2}}
\end{equation*}
people are needed; at least\(n = 204.08\) people. In practice, at least\(205\) people are needed to achieve this desired level of precision (that is, always round up in sample size calculations).
Estimating a mean depends on the variation in the observations. If the data have a small amount of variation, estimating the mean requires a smaller sample size as most observations are similar.
The formula requires a value for the sample standard deviation, \(s\text{.}\) But if we don’t have a sample yet, how can we have a value for the standard deviation of the sample to use? An approximate value for \(s\) is used, which can come from:
Section32.5Sample size for estimating a mean difference
The ideas in the previous section also work for computing sample sizes for estimating mean differences, since the differences can be treated like a single sample.
Example32.13.Sample size estimation for mean differences.
In Sect. Section 29.4, a CI is computed for the difference between the distances walked in \(6\mins\) (the six-minute walk test, 6MWT), using a \(20\ms\) and \(30\ms\) walkway [300], for \(50\) Thai patients. The approximate\(95\)% CI is from \(15.80\ms\) to \(28.26\ms\text{,}\) further for a \(30\ms\) walkway (i.e., the margin of error is \(6.234\ms\)).
Suppose we wanted to estimate the mean difference in the 6MWT distances for Malaysian patients; we could use the value of \(s\) from this study (i.e., \(s = 22.03920\)). Also, suppose we wanted a precision of \(4\) (that is, the margin of error is \(4\)). For this more precise estimate, we would need a larger sample. So compute:
Formulas are available for computing sample sizes without these restrictions, but are more complicated than that given here. Again, an approximate value for \(s\) can come from a pilot study (Sect. Section 9.2), or from the results of a similar study.
Definition32.14.Sample size: difference between two means.
Conservatively, the size of the simple random sample needed for a \(95\)% CI for the difference between two means with a specified margin of error is at least
Example32.15.Sample size estimation for difference between means.
In Sect. Section 30.7, a CI is computed for difference between the mean speeds of cars before and after signage was added [120]. Suppose we wanted to estimate the difference between the mean reaction times within \(5\kms\text{.}\)h^\(-1\)^.
In Sect. Section 30.7, the two groups (before and after signage added) produced standard deviations of \(13.194\) and \(13.134\) (which are very similar). We decide to use \(s = 13.15\) in the sample-size calculation as the common value of \(s\text{:}\)
We would need to measure the speed of at least \(56\) cars before signage was added, and another \(56\) cars after the addition of signage (rounding up the result).
Section32.7Sample size for estimating a difference between proportions
A formula for computing sample sizes for estimating the difference between two proportions is simple if we assume the sample size in both groups being compared is the same. Formulas are available for computing sample sizes without this restriction, but are more complicated than that given here.
Definition32.16.Sample size: difference between two proportions.
Conservatively, the size of the simple random sample needed for a \(95\)% CI for the difference between two proportions with a specified margin of error is at least
Example32.17.Sample size estimation for difference between proportions.
In Sect. Section 31.9, a CI is computed for difference between the proportion of infected turtles nests, comparing natural and relocated nests [196]. Suppose we wanted to estimate the difference between the proportion of infected nests within \(0.15\text{.}\)
Section32.8More details about these sample size calculations
The above calculations form just one part of the information needed to make the final decision about the necessary sample size. For example, the cost (time and money) of taking the samples has not been considered.
The calculations in this chapter assume a simple random sample will be used, which is often unreasonable. Other, more complex, formulas are available for computing sample sizes for other random-sampling schemes (such as stratified samples). However, the above calculations give an approximate minimum sample size required. In addition, the calculations in this chapter are only for producing \(95\)% CI.
In practice, researchers often start with a slightly larger sample than calculated to allow for drop-outs (e.g., plants die, or people withdraw from the study).
Section32.9Example: emergency residential aged care
[249] studied residential aged care residents in Australia needing emergency care and recorded, among other information, the average age of such residents (\(\bar{x} = 85\text{;}\)\(s = 7.3\)) and the proportion of calls related to falls (\(\hat{p} = 0.156\)).
Suppose a similar study was to be conducted in New Zealand. The aim was to estimate the mean age of residents within \(2\) years of age, and the proportion of incidents related to falls within \(0.10\text{.}\)
Estimating a sample size is a compromise between the precision of the estimate, and the need to remain ethical and reduce costs. All else being equal, making a sample size four times as large results in a CI half as wide. This means that large gains in precision are made by increasing small sample sizes, but only small gains are made by increasing already-large sample sizes.
What size samples are needed to estimate the difference between the population means within \(2\cms\) (that is, the CI will be half as wide as in the first calculation)?
What size samples are needed to estimate the difference between the population means within \(1\cms\) (that is, the CI will be a quarter as wide as in the first calculation)?
[229] studied of the eating habits of university students in Canada (Sect. Exercise 22.11.5). They estimated the proportion of Canadian students that ate a sufficient number of servings of grains each day.
Suppose we wished to repeat the study but for New Zealand university students; that is, we seek an estimate of the population proportion of New Zealand students that eat a sufficient number of servings of grains each day (with \(95\)% confidence).
Suppose we wish our \(95\)% CI to have a margin of error of \(0.025\text{;}\) that is, we wish to halve the width of the interval above. How many Kenyans would need to be surveyed?
[26] measured the lung capacity of \(11\)-year-old girls in East Boston, using the forced expiratory volume (FEV) of the children (Exercise Exercise 23.9.3). Suppose we wished to repeat the study, and find a \(95\)% CI for the mean FEV for \(11\)-year-old Australian girls.
Since Australian and American children might be somewhat similar, we could use, as an approximation, the standard deviation from that study: \(s = 0.43\Ls\text{.}\)
Suppose we wished to find \(99\)% (not \(95\)%) CI for the mean FEV for \(11\)-year-old Australian girls, within \(0.10\Ls\text{.}\) Would this sample size be larger or smaller than the sample size found for a \(95\)% CI (also within \(0.10\Ls\))?
[236] asked paramedics (\(n = 199\)) to estimate the amount of blood loss on four different surfaces. When the actual amount of blood spill on concrete was \(1 000\mLs\text{,}\) the mean guess was \(846.4\mLs\) (with a standard deviation of \(651.1\mLs\)). For a different study:
Skypilot is an alpine wildflower native to the Colorado Rocky Mountains (USA). In recent years, a willow shrub has been encroaching on skypilot territory and, because willow often flowers early, [117] studied whether the willow may ’negatively affect pollination regimes of resident alpine wildflower species’ (p. \(6 965\)). Data for both species was collected at \(25\) different sites, so the data are paired by site. The ’first-flowering day’ is the number of days since the start of the year (e.g., January \(12\) is ’day \(12\)’) when flowers were first observed.
[114] studied treating hypertension with Captopril. Patients had their systolic blood pressure measured (in mm Hg) immediately before and two hours after being given the drug. A pilot study showed that the difference between the two measurements had a standard deviation of about \(9\mms\) Hg.
[180] studied gray whales (Eschrichtius robustus) and measured (among other variables) the length of whales at birth. Summary information is shown in Table Table 30.24. Suppose another research study wanted to study sperm whales, which have an approximately similar size.
Determine the sample size needed to estimate the difference between the mean lengths for female and male sperm whales at birth, within \(0.15\ms\text{.}\)
Determine the sample size needed to estimate the difference between the mean lengths for female and male sperm whales at birth, within \(0.10\ms\text{.}\)
Suppose researchers are trialling a new drug to reduce the recovery time (compared to standard treatments) after contracting pneumonia. They conduct a pilot study, and find the standard deviation of the duration of the symptoms, in both groups, is about \(s = 1.25\) days.
Table Table 31.39 summarises the data from a study of the incidents of in-hospital heart attacks for people admitted following an earlier heart attack. To estimate the difference between the proportion of patients having an in-hospital heart attack (between patients with a low body temperature and patients with a high body temperature) within \(0.03\text{,}\) what size samples are needed?
Exercise Exercise 31.13.13 describes a study comparing the proportion of females and males who wore sunglasses in Brisbane, Australia [166]. Suppose we wished to make a similar comparison for people in Auckland, estimating the difference in the proportions within \(0.07\text{.}\) How many females and males would be needed?