Chapter31Comparing two odds or proportions: CIs and tests
This chapter compares two groups measured on a two-level qualitative variable, using confidence intervals and hypothesis tests based on the difference between two proportions, or on the odds ratio (OR) comparing two odds.
You have learnt to ask an RQ, design a study, classify and summarise the data, construct confidence intervals, and conduct hypothesis tests. In this chapter, you will learn to:
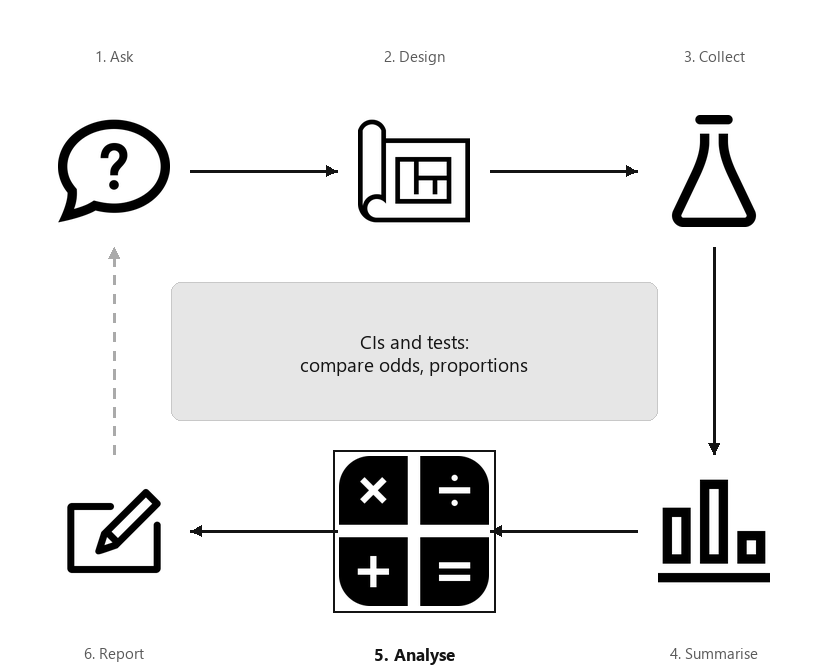
A diagram showing the six steps of research, arranged in a cycle: Ask, Design, Collect, Classify and summarise, Analyse, Report. Step 5 (Analyse) is highlighted, captioned “CIs and tests: compare odds, proportions”.
[229] examined the relationship between where university students usually ate, and where the student lived, for students from two Canadian universities. The researchers cross-classified the \(n = 183\) students (the units of analysis) according to two qualitative variables:
Both variables are qualitative, so means are not appropriate for summarising the data. The data can be compiled into a two-way table of counts (Table Table 31.2), also called a contingency table. Both qualitative variables have two levels, so this is a \(2\times 2\) table. Every cell in the \(2\times 2\) table contains different students, so the comparison is between individuals.
The study has one sample of students, classified according to two variables (i.e., each student is placed into one of the four cells in the \(2\times 2\) table).
The proportion of students who eat most meals off-campus can be compared between those who live with their parents and those who do not live with their parents. Then, the parameter is the difference between the population proportions in each group.
Alternatively, the odds of students who eat most meals off-campus can be compared between those who live with their parents and those who do not live with their parents. Then, the parameter is the comparison of the odds in both groups, the odds ratio (OR); specifically, the OR of eating most meals off-campus, comparing those living with parents to those not living with parents.
The table can be constructed with either variable as the rows. However, software commonly compares rows, so it makes sense to place the groups to be compared (i.e., the levels of the explanatory variable) in the rows of the table.
Since two groups are being compared, subscripts are used to distinguish between the two groups; say, Groups \(1\) and \(2\) in general (Table Table 31.4). For this example, we use \(N\) to refer to students not living with their parents, and \(L\) for students living with their parents.
The parameter is either a difference between two population proportions, or a population OR. For example, the parameter could be the difference between population proportion of students eating most meals off-campus, comparing students living with their parents, to students not living with their parents. Alternatively (and equivalently), the parameter could be the population OR of eating most meals off-campus, comparing students living with their parents, to students not living with their parents.
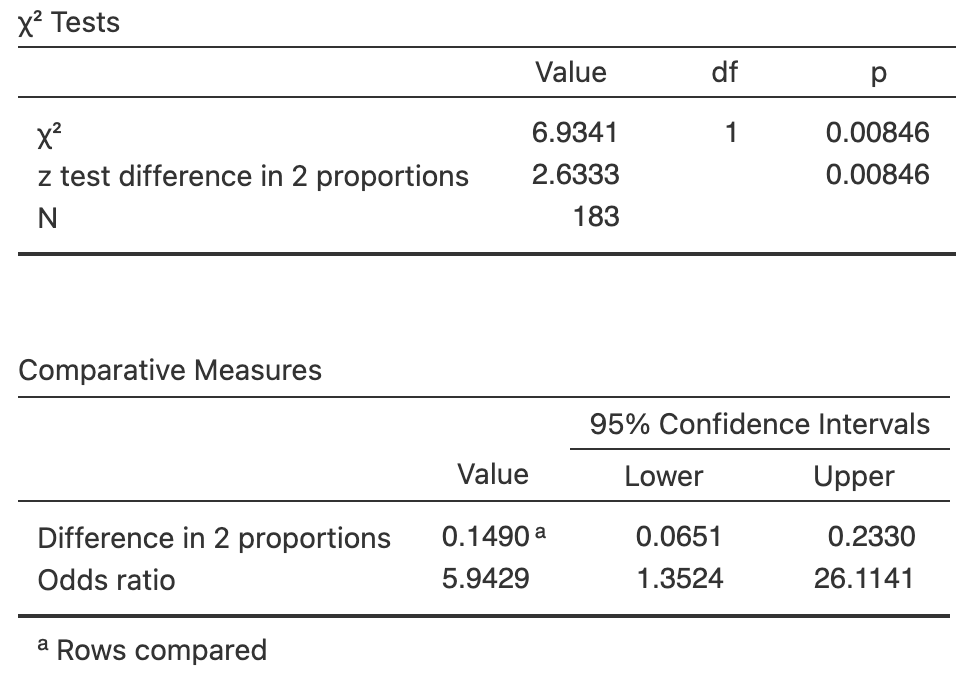
Figure31.5.Software output for comparing the odds and proportion of students eating most meals at home, for students living with and not with their parents.
Since software commonly compares rows (for example, see the text under the bottom table in Fig. Figure 31.5), it makes sense to place the groups to be compared (i.e., the explanatory variable) in the rows of the table.
Then, the difference between the two proportions are usually calculated as the Row 1 proportion minus the Row 2 proportion. Similarly, the odds then can be interpreted as comparing Column 1 counts to Column 2 counts, and the odds ratio as comparing the Row 1 odds to the Row 2 odds.
The RQ and the hypotheses can be written as comparing proportions (Sect. Section 31.4), comparing odds (Sect. Section 31.6), or about ORs. With two qualitative variables, an appropriate numerical summary includes the odds and proportions (or percentages) for the outcome for both comparison groups, and the sample sizes (Table Table 31.9).
To compare the proportions, define the sample proportion of students eating most meals off-campus as \(\hat{p}\text{,}\) and write \(\hat{p}_L\) for the proportion living with parents and \(\hat{p}_N\) for the proportion not living with parents. Then,
(as in the software output: Fig. Figure 31.5). By this definition, the difference is how much greater the proportion eating most meals off-campus is for students living with their parents, compared to students not living with their parents.
(Notice the numbers in the second column are always on the bottom of the fraction.) So the OR of eating most meals off-campus (the first column), comparing students living with parents to students not living with parents (second column), is \(26 \div 4.375 = 5.943\) (as in the software output: Fig. Figure 31.10).
The numerical summary (Table Table 31.9) shows the proportion and odds of eating most meals off-campus, comparing students living at home and those not living at home.
Odds and ORs are computed with the first row and first column values on the top of the fraction. Since the explanatory variable is usually in the rows, the second is usually the most useful. In this case, both of the above approaches produces an OR of \(5.943\text{.}\)
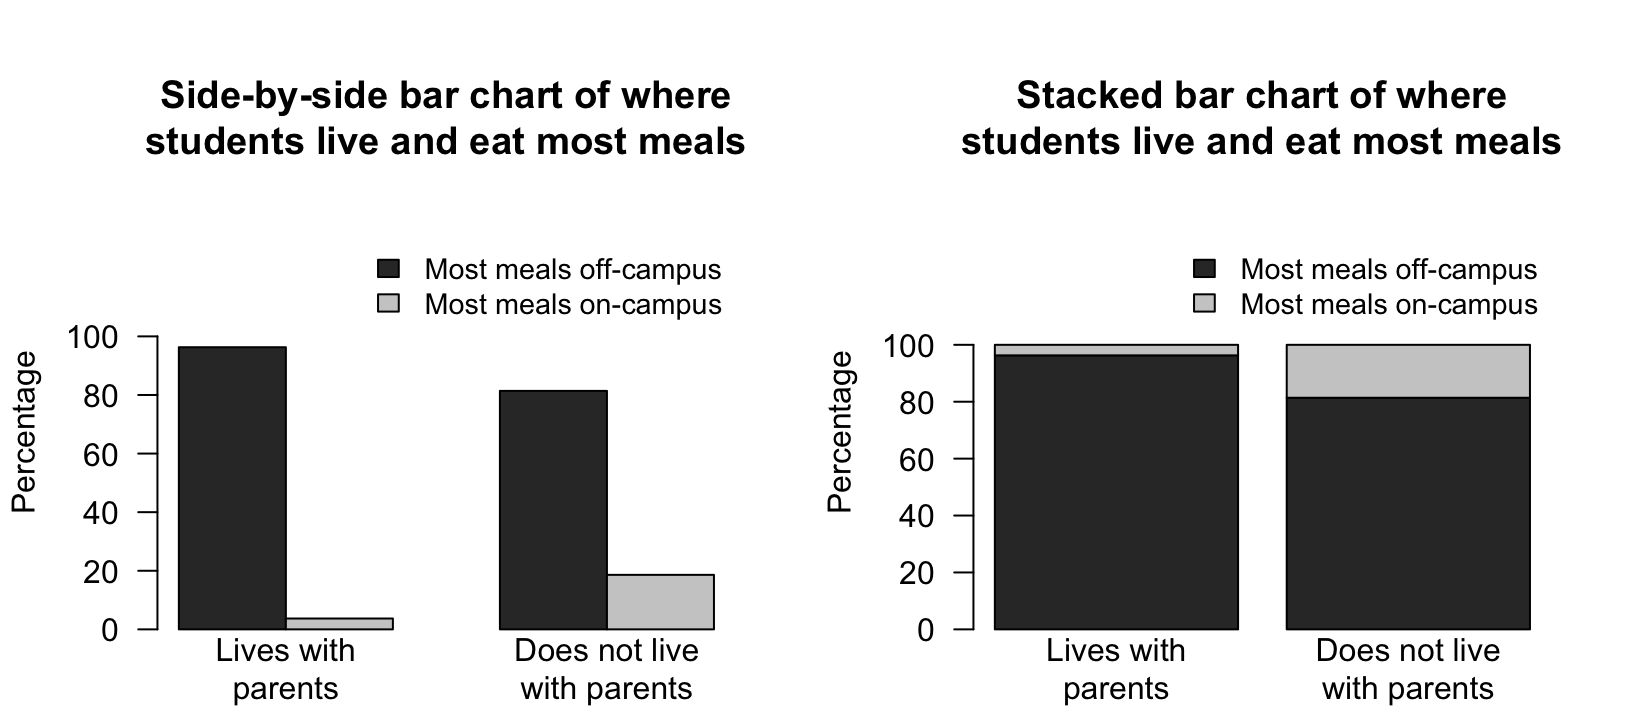
An appropriate graph is a side-by-side bar chart or a stacked bar chart (Fig. Figure 31.10). The side-by-side bar is useful for comparing odds. For instance, in the two left-most bars in Fig. Figure 31.10 (left panel), the first bar is \(26\) times as high as the second bar (and \(26\) is the odds); in the two right-most bars, the first bar is \(4.375\) times as high as the second bar (and \(4.375\) is the odds). A stacked bar chart is useful for comparing proportions.
Section31.3Confidence intervals for comparing proportions
The sample proportions for each group will vary from sample to sample, and the difference between the sample proportions will be different for each sample. Hence, the difference between the two sample proportions has a sampling distribution and standard error. Under certain conditions (Sect. Section 31.7), this sampling distribution has a normal distribution.
Definition31.11.Sampling distribution for the difference between two sample proportions for a CI.
When constructing a CI, the sampling distribution of the difference between two sample proportions\(\hat{p}_1\) and \(\hat{p}_2\) is (when the appropriate conditions are met; Sect. Section 31.7) described by:
with a standard deviation, called the standard error of the difference between the proportions, of \(\displaystyle\text{s.e.}(\hat{p}_1 - \hat{p}_2)\text{.}\)
The sampling distribution describes how the values of \(\hat{p}_L - \hat{p}_N\) vary from sample to sample. Then, finding a \(95\)% CI for the difference between the proportions is similar to the process used previously, since the sampling distribution has an approximate normal distribution:
or \(0.149 \pm 0.0857\) after rounding (i.e., from \(0.0633\) to \(0.235\)). This approximate CI is very similar to the (exact) CI from software (Fig. Figure 31.10). We write:
The difference between the proportions of students eating most meals at home is \(0.1490\text{,}\) higher for those living with their parents (\(0.963\text{;}\)\(n = 52\)) than those not living with their parents (\(0.814\text{;}\)\(n = 129\)), with the approximate \(95\)% CI from \(0.0633\) to \(0.235\text{.}\)
The plausible values for the difference between the two population proportions are between \(0.063\) to \(0.235\text{,}\) larger for those living with parents.
Giving the CI alone is insufficient; the direction in which the differences were calculated must be given, so readers know which group had the higher proportion.
Is the population proportion of students eating most meals off-campus the same for students living with their parents and for students not living with their parents?
Hypothesis testing always begins by assuming that the null hypothesis is true (Sect. Subsection 28.2.1). In this context, that means assuming that the population proportion of eating most meals off-campus is the same in both groups:
Because the null hypothesis is assumed to be true, the proportions are assumed to have the same value for both groups. Hence, the data from the two groups can be combined to determine an overall (or common) proportion of students eating most meals off-campus:
This is the overall proportion of students eating most meals off-campus, since we assumed no difference between students living with and not with their parents. Effectively, this proportion has been computed by summing the columns in Table Table 31.2 and using this combined data to compute the proportion of students eating most meals off-campus.
As with any hypothesis test, the null hypothesis is assumed to be true. For a test comparing two proportions, that implies the proportion in each group is the same, and so the standard errors are computed using the common (overall) proportion.
The sample proportions for the two groups (\(L\) and \(N\)) will vary from sample to sample and so have a sampling distribution. The standard error of the sample proportion for each sample is computed using this common proportion \(\hat{p}\text{,}\) using the same idea as in Equation (22.3):
The difference between the two proportions will vary from sample to sample too, and hence have a sampling distribution; under certain conditions (Sect. Section 31.7), this sampling distribution will have a normal distribution. The standard error of this sampling distribution for the difference between the proportions is
which is similar to Equation (31.1), except that a common proportion was used to compute \(\text{s.e.}(\hat{p}_L)\) and \(\text{s.e.}(\hat{p}_N)\text{.}\)
Definition31.15.Sampling distribution for the difference between two sample proportions for a hypothesis test.
When conducting a hypothesis test, the sampling distribution of the difference between two sample proportions\(\hat{p}_1\) and \(\hat{p}_2\) is (when the appropriate conditions are met; Sect. Section 31.7) described by:
with a standard deviation, called the standard error of the difference between the proportions, of \(\displaystyle\text{s.e.}(\hat{p}_1 - \hat{p}_2)\text{.}\)
Since the sampling distribution has an approximate normal distribution, the approximate \(P\)-value can be computed from normal distribution tables (Sect. Section 20.6), approximated using the \(68\)–\(95\)–\(99.7\) rule, or from software output (Fig. Figure 31.5). The two-tailed \(P\)-value reported by software (Fig. Figure 31.5, under the column p) is indeed small: \(0.008\) to three decimal places.
A small \(P\)-value means strong evidence exists to supporting \(H_1\text{:}\) the evidence suggests a difference between the population proportions. We write:
The sample provides strong evidence (\(z = 2.63\text{;}\) two-tailed \(P = 0.008\)) that the proportion of students in the population of having most meals off-campus is different for students living with their parents (proportion: \(0.963\text{,}\)\(n = 54\)) and students not living with their parents (proportion: \(0.814\text{,}\)\(n = 129\text{;}\) difference: \(0.149\text{;}\) approximate \(95\)% CI from \(0.0633\) to \(0.235\text{,}\) higher for students living with their parents).
The conclusion includes three components (Sect. Section 28.8): the answer to the RQ; the evidence used to reach that conclusion (’\(z = 2.63\text{;}\) two-tailed \(P = 0.008\)’); and some sample summary statistics (including the \(95\)% CI for the difference between proportions). The conclusion makes clear which proportion is higher.
Section31.5Confidence intervals for comparing odds (for an odds ratio)
A CI can be formed for the OR, as well as for the difference between two proportions. Every sample of students is likely to be different, and hence the odds of students eating off campus will vary from sample to sample (in both groups). Hence, the OR varies also from sample to sample. That is, sampling variation exists, so the OR has a sampling distribution.
However, the sampling distribution of the sample OR does not have a normal distribution. (For those interested: the logarithm of the OR has an approximate normal distribution under certain conditions.) For this reason, the CI for the OR will be taken directly from software output, and the sampling distribution is not discussed.
Software (Fig. Figure 31.10, right panel) gives the sample OR as \(5.94\text{,}\) and the (exact) \(95\)% CI as \(1.35\) to \(26.1\text{.}\) The value of the OR is the same as the value computed manually.
The odds of students eating most meals off-campus is \(5.94\text{,}\) higher for students living with their parents (odds: \(26.0\text{;}\)\(n = 54\)) than for students not living with their parents (odds: \(4.38\text{;}\)\(n = 129\)), with the \(95\)% CI from \(1.35\) to \(26.1\text{.}\)
There is a \(95\)% chance that this CI straddles the population OR. Notice that the meaning of the OR is explained in the conclusions: the odds of eating most meals off-campus, and comparing students living with parents to not living with parents.
The CI for an OR is not symmetrical, like the others we have seen (for those interested: this is because the OR has no upper limit, but the lower limit of an OR is zero; the logarithm of the limits of the CI form a symmetric interval); that is, the sample OR of \(5.94\) is not in the centre of the CI.
Are the population odds of students eating most meals off-campus the same for students living with their parents and for students not living with their parents?
Is the population OR of eating most meals off-campus, comparing students who live with their parents to students not living with their parents, equal to one?
This hypothesis proposes that the sample odds are not the same in the two groups only due to sampling variation. This is the initial assumption. The alternative hypothesis is
\(H_0\text{:}\) The population odds of eating most meals off-campus is the same for students living with their parents and for students not living with their parents.
\(H_1\text{:}\) The population odds of eating most meals off-campus is different for students living with their parents and for students not living with their parents.
As usual, the decision-making process starts by assuming the null hypothesis is true: that the population OR is one (i.e., the population odds in each group are equal).
For two-way tables, RQs can be framed in terms of ORs, comparing odds, comparing proportions, or (for larger two-way table) using associations (or relationships).
For consistency: if the RQ is about odds, the hypotheses and conclusion should be about the odds; if the RQ is about proportions, the hypotheses and conclusion should be about the proportions; and so on.
Assuming the null hypothesis is true (which is the initial assumption made) means that the odds are the same in both groups (and the proportions are the same in both groups too). That is, the proportions of students eating most meals off-campus is the same for students living with and not living with their parents. Let’s consider the implication.
From Table Table 31.2, \(157\) students out of \(183\) ate most meals off-campus, so that \(157 \div 183 = 0.8579\) of students in the entire sample ate most of their meals off-campus (which is the common proportion found in Equation (31.2)).
If the proportion of students who eat most of their meals off-campus is the same for those who live with their parents and those who don’t, then we’d expect\(0.8579\) of students in both groups to be eating most meals off-campus. In other words, the two conditional probabilities would be the same. In that case:
we would expect a proportion of \(0.8579\) of the \(54\) students who live with their parents (i.e., \(0.8579\times 54 = 46.33\) students) to eat most meals off-campus.
we would expect a proportion of \(0.8579\) of the \(129\) students who don’t live with their parents (i.e., \(0.8579\times 129 = 110.67\) students) to eat most meals off-campus.
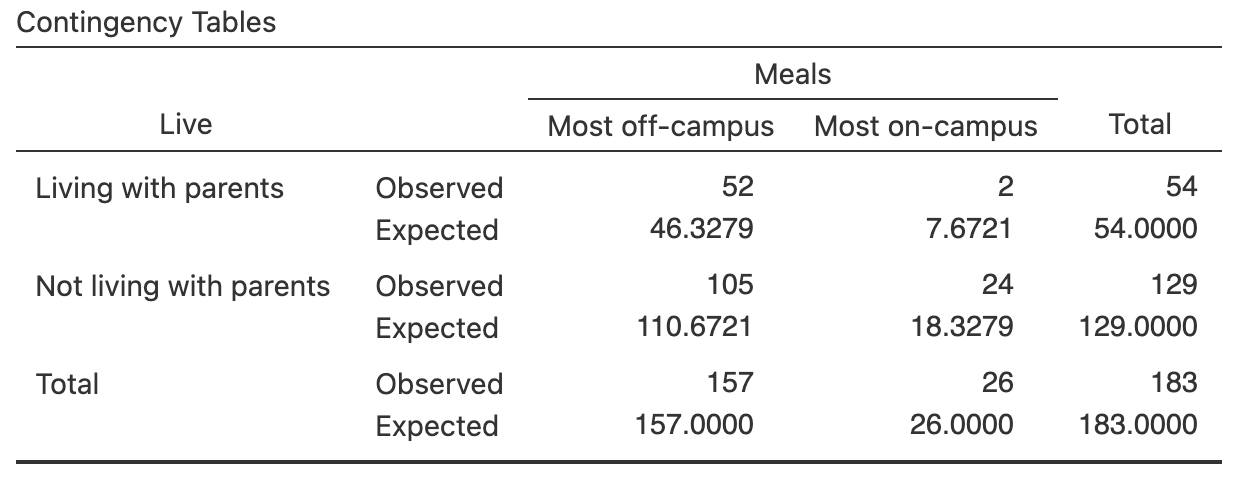
In other words, the proportions (and hence the odds) of eating most meals off-campus is the same in each group. Those are the expected counts if the proportions (or odds) were exactly the same in each group (Table Table 31.21), as assumed in \(H_0\text{.}\)
How close are the observed counts (Table Table 31.2) to the expected counts (Table Table 31.21)? For instance, \(46.33\) of the \(54\) students who live with their parents are expected to eat most meals off-campus; yet we observed \(52\text{;}\)\(110.67\) of the \(129\) students who don’t live with their parents are expected to eat most meals off-campus; yet we observed \(105\text{.}\)
The observed and expected counts are similar, but not the exactly same. The difference between the observed and expected counts may be explained by sampling variation (that is, the null hypothesis explanation).
The hypothesis test effectively compares the observed counts to the expected counts (assuming no relationship between the variables) over the whole \(2\times 2\) table.
You do not have to compute the expected counts explicitly (software does it in the background, or explicitly if requested). However, seeing how the decision-making process works in this context is helpful.
In previous hypothesis tests, the sampling distribution had an approximate normal distribution. However, the sampling distribution of the OR is more complicated (for those interested: the logarithm of the sample ORs have an approximate normal distribution, and hence a standard error), so will not be presented. We will use software output only to conduct the test.
Subsection31.6.3Computing the value of the test statistic
The decision-making process compares what is expected if the null hypothesis about the parameter is true (Table Table 31.21) to what is observed in the sample (Table Table 31.2). Previously, when the sampling distribution was a normal distribution, the test statistic was a \(t\)-score or a \(z\)-score. However, the sampling distribution for an OR does not have a normal distribution, and so a different test statistic is needed.
In this context, the test-statistic is ’chi-squared’, written \(\chi^2\text{.}\) The \(\chi^2\)-score measures the overall size of the differences between the expected counts and observed counts, over the entire \(2\times 2\) table.
The Greek letter \(\chi\) is pronounced ’kie’, as in kite (not ’chi’ as in China or in chin). The test statistic \(\chi^2\) is pronounced as ’chi-squared’.
From the software (Fig. Figure 31.5), \(\chi^2 = 6.934\text{.}\) But what does this value mean? Is it ’large’ or ’small’? The \(\chi^2\)-value, for \(2\times 2\) tables of counts, has an equivalent \(z\)-score, so that a \(P\)-value can be estimated using the \(68\)–\(95\)–\(99.7\) rule. The \(\chi^2\)-value is equivalent to
\begin{equation*}
z = \sqrt{\chi^2}\qquad\text{for a $2\times 2$ table of counts only}.
\end{equation*}
Here then, the \(\chi^2\)-value is equivalent to a \(z\)-score of \(\sqrt{6.934} = 2.633\text{.}\) This is the same\(z\)-score produced when comparing two proportions (Sect. Section 31.4; Fig. Figure 31.5), and hence the \(P\)-value will be the same also. Using the \(68\)–\(95\)–\(99.7\) rule, a small \(P\)-value is expected. The two-tailed \(P\)-value reported by software (Fig. Figure 31.5, under the column p) is indeed small: \(0.008\) to three decimals.
A very small \(P\)-value (\(0.008\) to three decimals) means strong evidence exists to supporting \(H_1\text{:}\) the evidence suggests a difference in the population odds in the two groups. We write:
The sample provides strong evidence (\(\chi^2 = 6.934\text{,}\)\(n = 54\text{;}\) two-tailed \(P = 0.008\)) that the odds in the population of having most meals off-campus is different for students living with their parents (odds: \(26\)) and students not living with their parents (odds: \(4.375\text{,}\)\(n = 129\text{;}\) OR: \(5.94\text{;}\)\(95\)% CI from \(1.35\) to \(26.1\)).
The conclusion includes three components (Sect. Section 28.8): the answer to the RQ; the evidence used to reach that conclusion (’\(\chi^2 = 6.934\text{;}\) two-tailed \(P = 0.008\)’); and some sample summary statistics (including the \(95\)% CI for the OR).
The conclusion makes clear what the odds and the OR mean. The odds are described as the ’odds of having most meals off-campus’, and the OR as then comparing these odds between ’students living with their parents and students not living with their parents’.
The statistical validity condition refers to the expected (not the observed) counts. In some software, the expected counts must be explicitly requested to see if this condition is satisfied (Fig. Figure 31.24). The units of analysis are also assumed to be independent (e.g., from a simple random sample).
For the student-eating data, the smallest observed count is \(2\) (living with parents; most meals off-campus), but the smallest expected count (see Table Table 31.21 or Fig. Figure 31.24) is \(7.67\text{,}\) which is greater than five. This means the two analyses (comparing proportions; comparing odds) are both statistically valid. The size of the expected counts is important for the statistical validity condition.
Usually, you do not compute these expected counts. However, a quick check for the statistical validity is to compute the smallest expected counts, using
Section31.8Hypothesis tests of independence more generally: \(\chi^2\)-tests
Often a table of counts is larger than \(2\times 2\text{.}\) In these situations, the RQ may not be able to be worded in terms of comparing proportions or odds. Instead, the hypotheses can be worded in terms of independence, relationships or associations (but not correlations) between the variables:
Example31.26.Two-way tables larger than \(2\times 2\).
[Dataset: RipsID] [340] studied Spanish people’s knowledge of ocean rips (Table Table 31.27). The table is a \(4\times 2\) two-way table. The rows are the age groups, as the age groups are being compared. The RQ is
The odds and percentage of people in each age group that can correctly identify rips can be computed (Table Table 31.28), but this is not always possible (e.g., for a \(3\times 4\) table). ORs compare pairs of odds, and the ORs in Table Table 31.28 are all relative to those in the \(51\) to \(65\) age group (hence, no OR is given for the \(51\) to \(65\) age group, which is the reference level). For example, the odds of someone aged \(18\) to \(24\) correctly identifying a rip is \(1.104\) times the odds of someone aged \(51\) to \(65\) correctly identifying a rip.
For tables larger than \(2\times 2\) more generally, the hypothesis are usually worded in terms of associations or relationships (but not correlations) between the variables:
The test statistic is a \(\chi^2\)-value, which compares the observed and expected counts; the expected counts are found in the same way as in Sect. Subsection 31.6.2.
For two-way tables larger than \(2\times 2\text{,}\) the parameter describing the association between the variables is the \(\chi^2\)-value. When no relationship exists in the sample, the observed and expected counts are the same, and \(\chi^2 = 0\text{.}\) The larger the difference between the observed and expected counts, the larger the value of \(\chi^2\text{.}\) Sampling variation means that the observed counts will vary from sample to sample, so that \(\chi^2\) may not be exactly zero, even if there is no association between the variables.
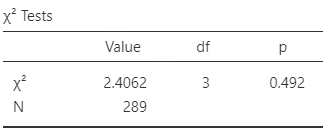
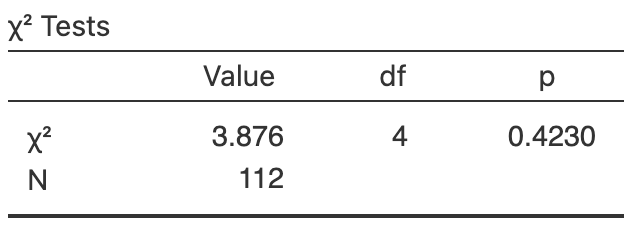
Software computes \(\chi^2 = 2.406\text{,}\) and the two-tailed \(P\)-value as \(P = 0.492\) (Fig. Figure 31.30, left panel). This \(P\)-value means there is not persuasive evidence to support the alternative hypothesis:
The sample provides no evidence (\(\chi^2 = 2.406\text{,}\)\(n = 289\text{;}\) two-tailed \(P = 0.492\)) of an association between age group and the ability to correctly identify a rip among Spanish people.
The hatching success of loggerhead turtles on Mediterranean beaches is often compromised by fungi and bacteria. [196] studied the odds of a nest being infected, comparing relocated nests (relocated due to the risk of tidal inundation), and non-relocated nests (Table Table 31.31). The researchers were interested in knowing:
Here, \(N\) refers to Natural nests, and \(R\) to Relocated nests. The parameter is the odds ratio of a nest being infected, comparing natural to relocated nests. (The equivalent hypotheses written in terms of proportions would be \(H_0\text{:}\)\(p_N - p_R = 0\) and \(H_1\text{:}\)\(p_N - p_R \ne 0\text{.}\) The hypotheses could also be written in terms of associations.)
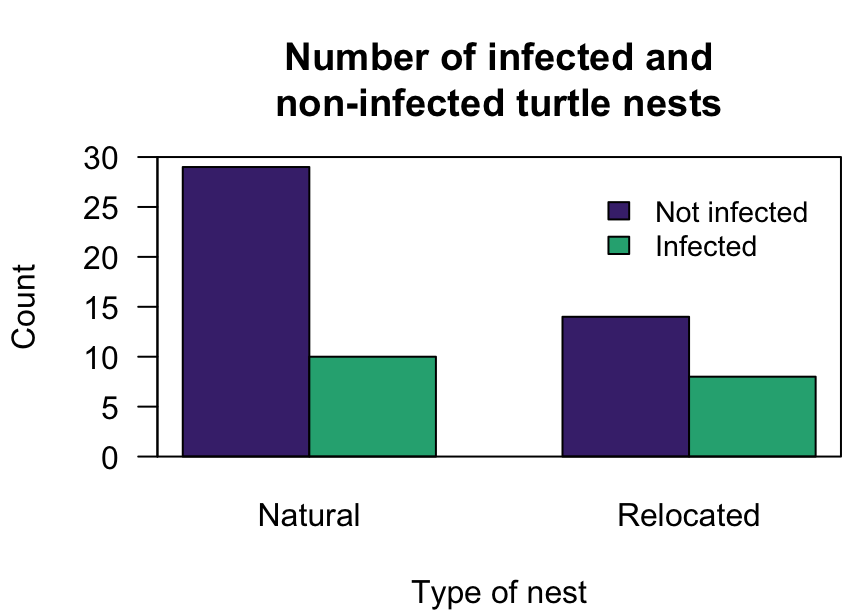
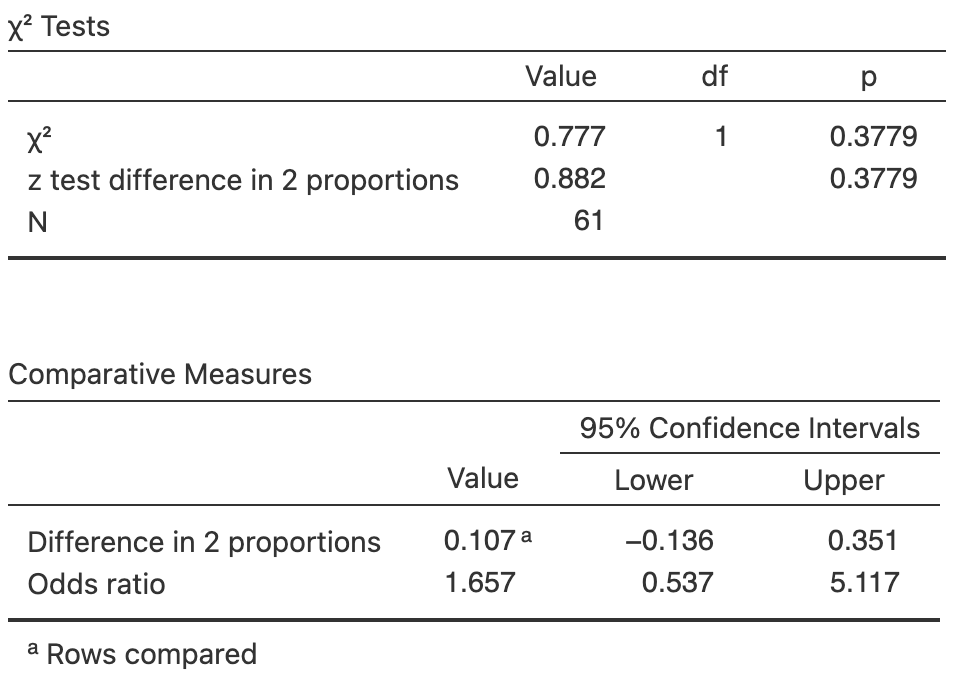
A graphical summary is shown in Fig. Figure 31.33. A numerical summary table (Table Table 31.32) shows that the odds of natural nest being infected is \(1.66\) times the odds of a relocated nest being infected. From the software output (Fig. Figure 31.35), the \(\chi^2\)-value is \(0.777\text{.}\) Since the table is a \(2\times 2\) table, the equivalent \(z\)-score can be found: \(z = \sqrt{0.777} = 0.88\text{.}\) This \(z\)-score is very small, so expect a large \(P\)-value. (This is the value of the \(z\)-score shown in Fig. Figure 31.35 for comparing two proportions.) The \(P\)-value is \(0.378\) on the output (for both tests).
The smallest expected count is \((22\times 18) / 61 = 6.49\text{,}\) which exceeds five, so the test is statistically valid. Since the RQ and hypotheses were written in terms of odds, the conclusion is also written in terms of odds:
There is no evidence of a difference in the odds of non-infection (\(\chi^2\text{:}\)\(0.777\text{;}\)\(P\)-value: \(0.378\text{;}\) OR: \(1.657\text{;}\)\(95\)% CI: \(0.537\) to \(5.12\)) between natural nests (odds: \(2.90\text{;}\)\(n = 39\)) and relocated nests (odds: \(1.75\text{;}\)\(n = 22\)).
We do not say whether the evidence supports the null hypothesis. We assume the null hypothesis is true, so we state the strength of evidence to change our mind (and hence support the alternative hypothesis). The current sample presents no evidence to contradict the assumption, but future evidence may emerge.
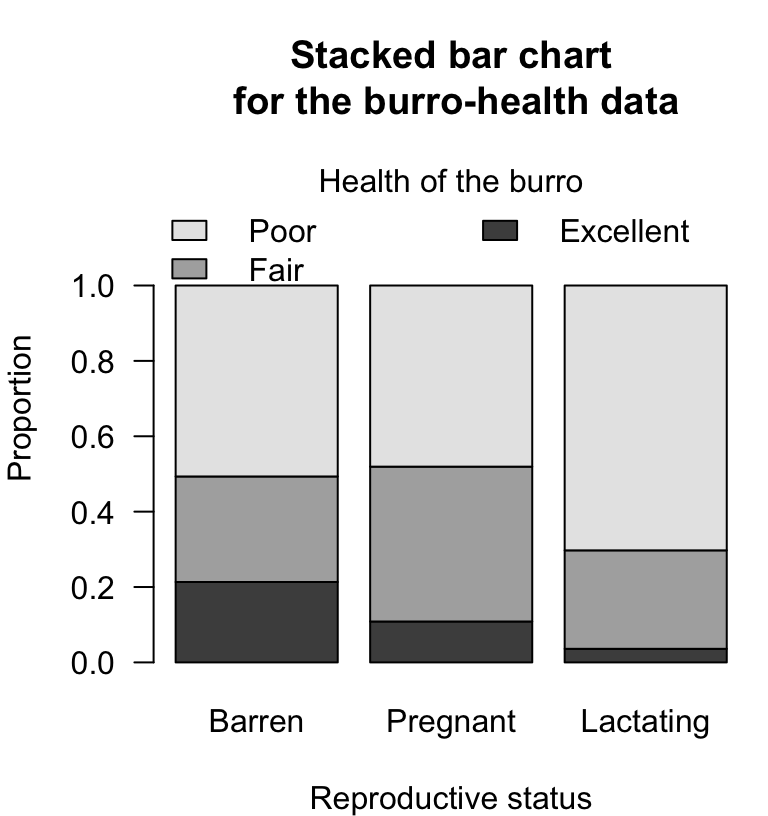
The data (Table Table 31.36) are given in a \(3\times 3\) table of counts. The data are summarised using row proportions in Table Table 31.37, and in a graph in Fig. Figure 31.38 (left panel). Software output is shown in Fig. Figure 31.38 (right panel).
From the software output (Fig. Figure 31.38, right panel), \(\chi^2 = 23.585\text{.}\) Notice that a comparison of proportions is not possible for tables larger than \(2\times 2\text{.}\) Software reports \(P < 0.001\text{,}\) which suggests very strong evidence in the sample that an association exists between reproductive status and overall health.
The sample provides very strong evidence (\(\chi^2 = 23.585\text{;}\)\(P < 0.001\text{;}\)\(3\times 3\) table) of an association between reproductive status and overall health of female burros (\(n = 315\)).
Adding sample summary information to this conclusion is cumbersome. Instead, readers can be pointed to the numerical summary (Table Table 31.37). Furthermore, CIs are not reported.
While we know there is an association between the variables, we can only speculate on the nature of the association (i.e., for which group(s) the population proportions are different). Formal methods for doing so requires methods beyond this book, but Fig. Figure 31.38 (left panel) suggests that lactating burros are far more likely to have poor health.
To compute a CI for the difference between two proportions, compute the difference between the two sample proportions, \(\hat{p}_1 - \hat{p}_2\text{,}\) and identify the sample sizes \(n_1\) and \(n_2\text{.}\) Then the standard error, which quantifies how much the value of \(\hat{p}_1 - \hat{p}_2\) varies across all possible samples, is
where \(\text{s.e.}(\hat{p}_1)\) and \(\text{s.e.}(\hat{p}_2)\) are the standard errors of Groups \(1\) and \(2\) (Equation (22.3)). The margin of error is (multiplier\({}\times{}\)standard error), where the multiplier is \(2\) for an approximate \(95\)% CI (using the \(68\)–\(95\)–\(99.7\) rule). Then the CI is:
Write the null hypothesis (\(H_0\)) and the alternative hypothesis (\(H_1\)); initially assume the value of \((p_1 - p_2)\) in the null hypothesis to be true.
Describe the sampling distribution, which describes what to expect from the difference between the sample proportions based on this assumption: under certain statistical validity conditions, the difference between the sample proportions vary with:
An approximate \(P\)-value can be estimated using the \(68\)–\(95\)–\(99.7\) rule, or an exact \(P\)-value found using software. Use the \(P\)-value to make a decision, and write a conclusion.
Find the value of the test statistic (a \(\chi^2\)-score) on the software output. (For \(2\times 2\) tables only, the equivalent \(z\)-score is \(\sqrt{\chi^2}\text{.}\))
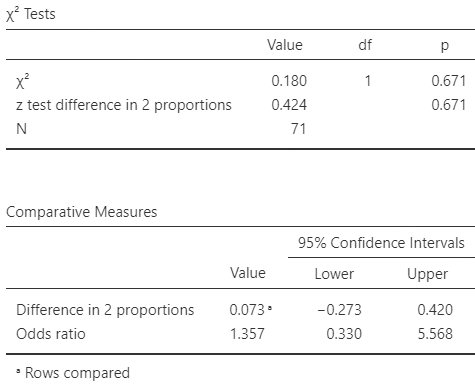
[322] investigated the relationship between body temperature of patients admitted to hospital following a heart attack (HA), and a having a subsequent HA while in hospital (Table Table 31.39).
Consider the expected counts in Table Table 31.21. Confirm that the odds of having most meals off-campus is the same for students living with their parents, and for students not living with their parents.
Sketch the sampling distribution for the difference between the proportions of students eating most meals off-campus, for those living with parents minus those not living with parents. What is the sampling distribution for the equivalent OR?
Sketch the sampling distribution for the difference between the proportion of non-infected turtle nests, for natural nests minus relocated nests (in Sect. Section 31.9). What is the sampling distribution for the equivalent OR?
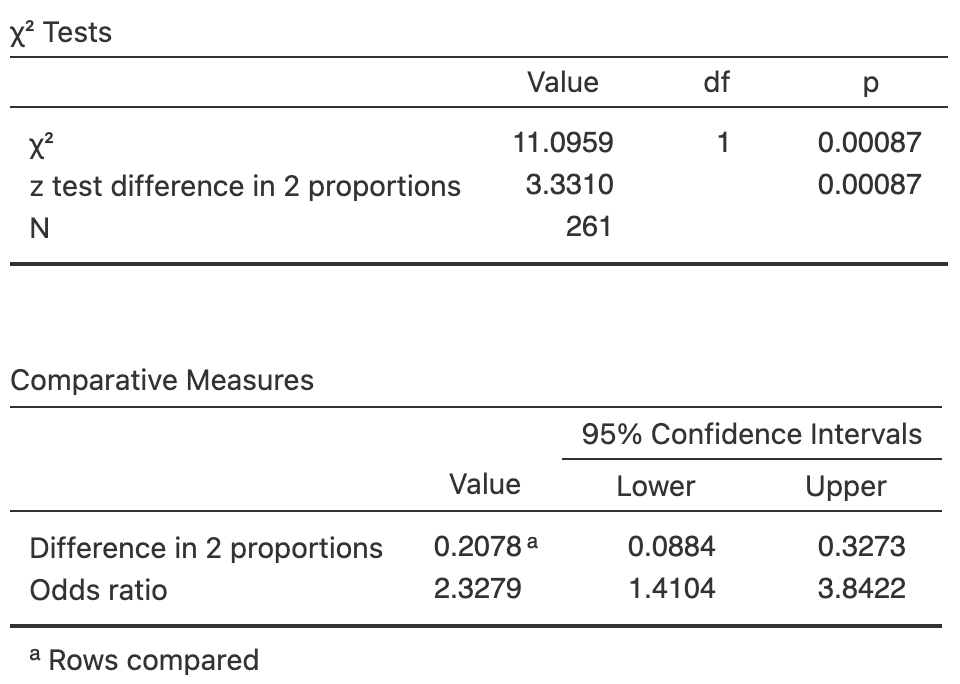
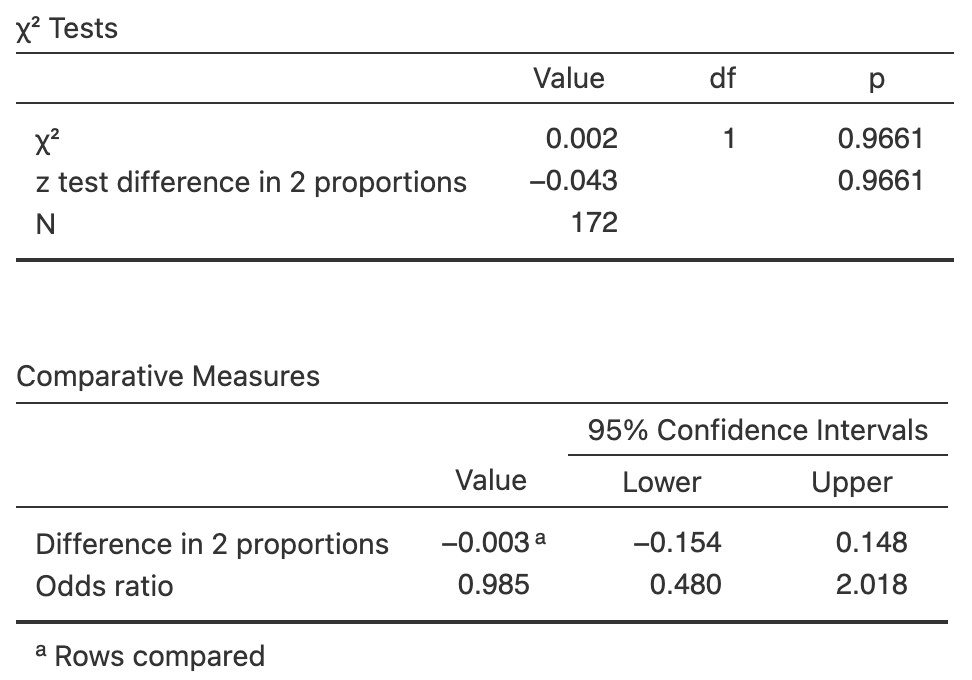
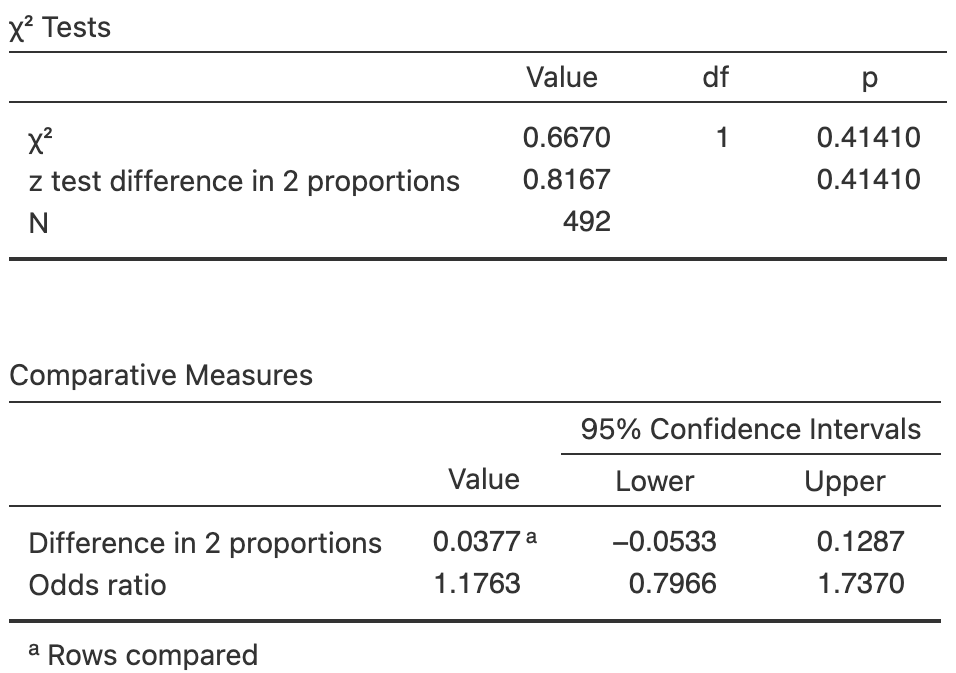
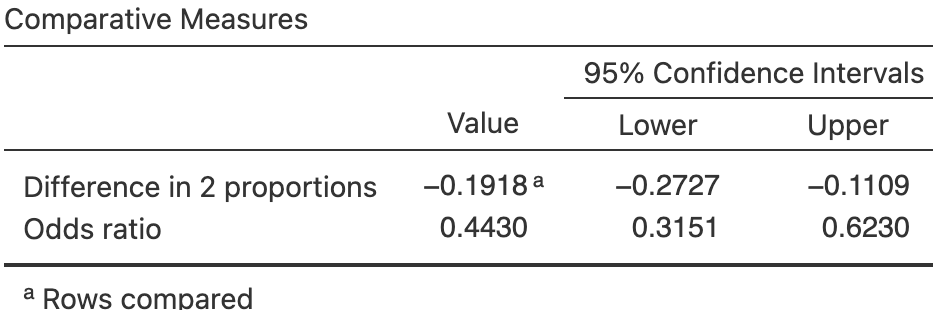
[Dataset: EVPurchase] [38] studied the adoption of electric vehicles (EVs) by a group of professional Americans (Table Table 31.41). Software output is shown in Fig. Figure 31.42.
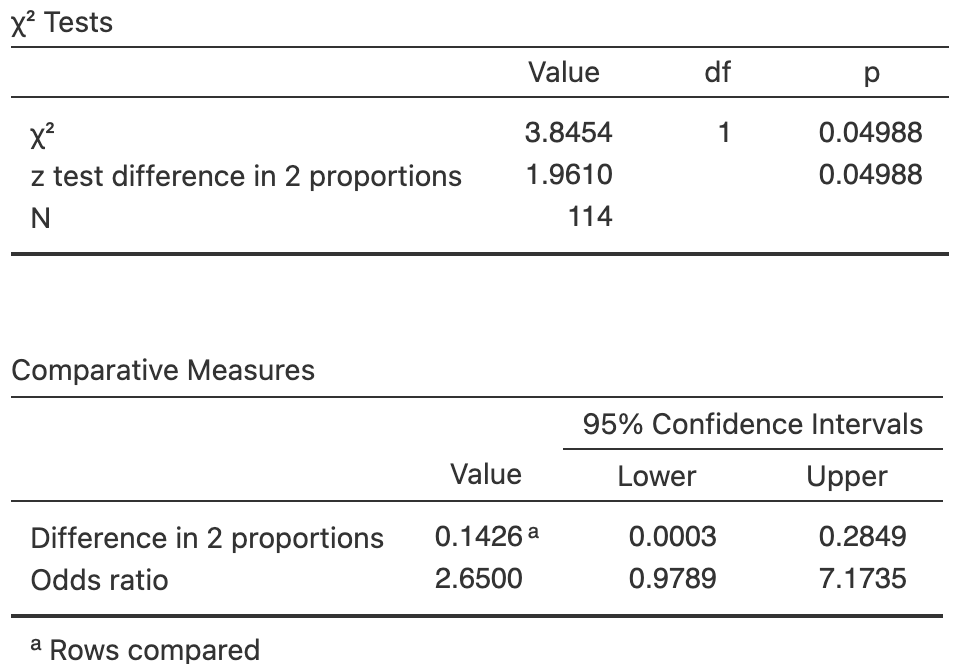
[349] investigated Ethiopian farmers’ adoption of improved soil and water conservation structures on their farms (Table Table 31.43). Software output is shown in Fig. Figure 31.44.
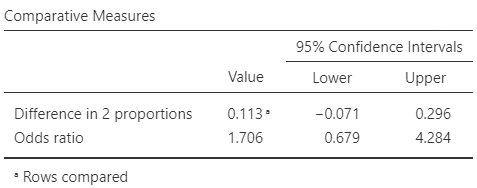
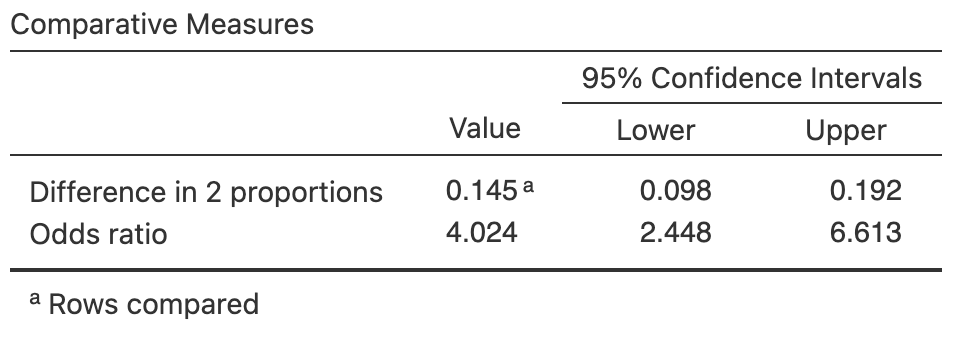
Compute the difference between the proportion of crashes involving a pedestrian from 2011 to 2015, consistent with the definition used in the output (Fig. Figure 31.46).
[Dataset: ScarHeight] [338] compared the heights of scars from burns received by people in Western Australia (Table Table 31.47). Software was used to analyse the data (Fig. Figure 31.48).
[Dataset: PetBirds] [330] examined people with lung cancer, and a matched set of controls who did not have lung cancer, and recorded the number in each group that kept pet birds. The data are shown in Table Table 31.49, and the software output in Fig. Figure 31.50.
[Dataset: EmeraldAug] The Southern Oscillation Index (SOI) is a standardised measure of the air pressure difference between Tahiti and Darwin, and is related to rainfall in some parts of the world [134], and especially Queensland [133].
The rainfall at Emerald (Queensland) was recorded for Augusts between 1889 and 2002 inclusive [143], where the monthly average SOI was positive, and when the SOI was non-positive (zero or negative), as shown in Table Table 31.51.
[Dataset: HatSunglasses] [166] recorded the number of people at the foot of the Goodwill Bridge, Brisbane, who wore hats between \(11\text{:}\)\(30\)am to \(12\text{:}\)\(30\)pm. Of the \(366\) females observed, \(22\) wore hats; of the \(386\) males observed, \(79\) wore hats.
[Dataset: Turbines] A study of turbine failures [350][352] ran \(73\) turbines for around \(1\,800\) hours, and found that seven developed fissures (small cracks). They also ran a different set of \(42\) turbines for about \(3\,000\) hours, and found that nine developed fissures.
[315] compared various types of repellents (including bear faeces) to prevent bears damaging trees in an Idaho forest. Part of the data are summarised in Table Table 31.55.
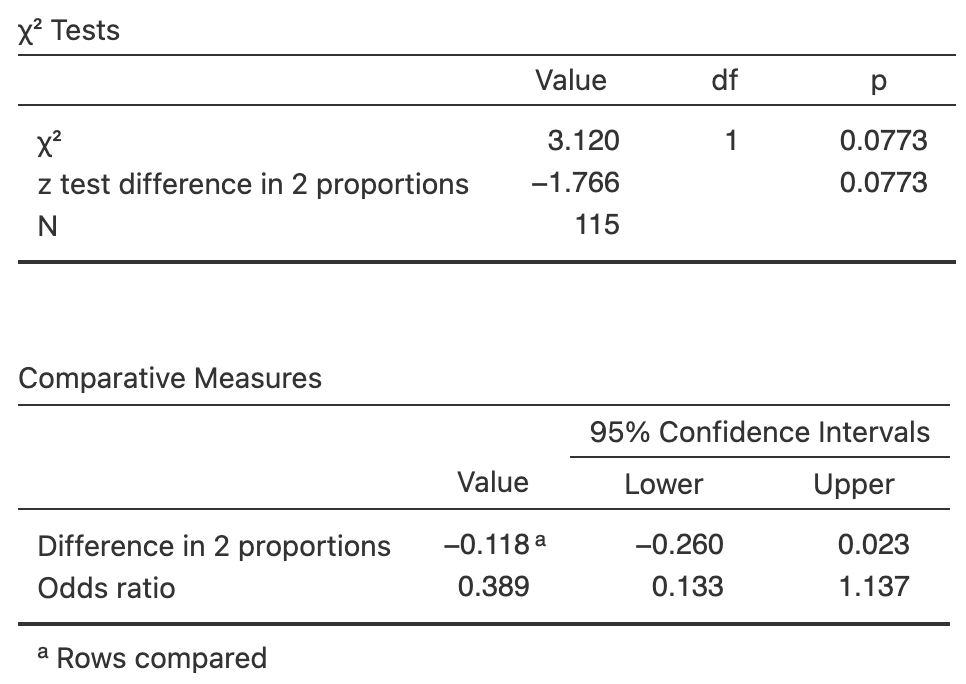
Software gives \(\chi^2\) as \(4.4850\text{.}\) What is the equivalent \(z\)-score (e.g., for the test of proportions)? Would you expect a large or small \(P\)-value?
[Dataset: B12Diet] [216] examined B12 deficiencies in ’predominantly overweight/obese women of South Asian origin living in Auckland’. Some women were on a vegetarian diet and some were not (Table Table 31.56). One RQ was:
Among this group of women, are the odds of being vitamin B12 deficient different for women on a vegetarian diet compared to women on a non-vegetarian diet?
Software gives \(\chi^2\) as \(4.7067\text{.}\) What is the equivalent \(z\)-score (e.g., for the test of proportions)? Would you expect a large or small \(P\)-value?
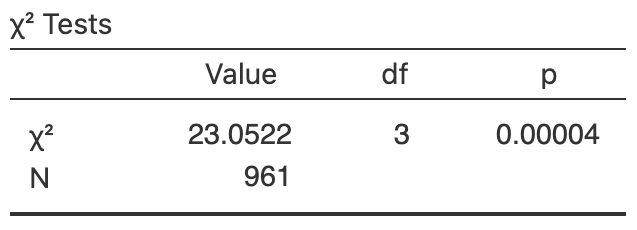
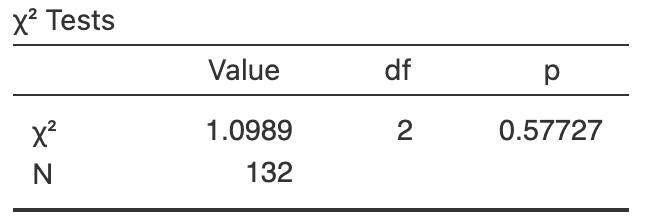
Construct a \(2\times 2\) table, recording the location of the anemones as either ’Central’ or ’Side’ without distinguishing which side. Hence, repeat the test using the \(2\times 2\) table (Fig. Figure 31.64, bottom output). (These data are in the file CrabShell2.)
Figure31.64.Software output for the \(3\times 3\) table of crab-shell data (top output), and for the \(2\times 2\) table of crab-shell data (bottom output).