So far, you have learnt to ask an RQ, design a study, classify and summarise the data, and form confidence intervals. In this chapter, you will learn to:
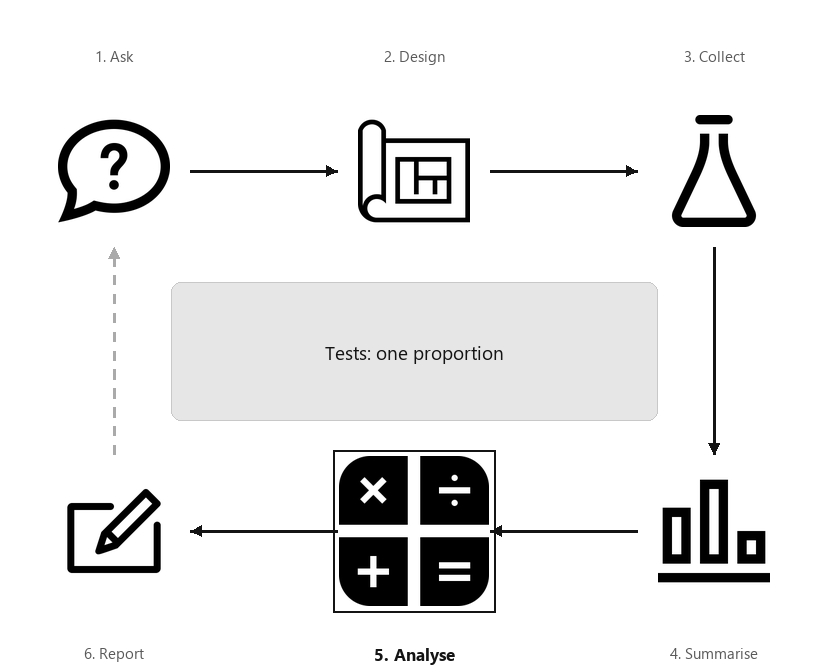
A diagram showing the six steps of research, arranged in a cycle: Ask, Design, Collect, Classify and summarise, Analyse, Report. Step 5 (Analyse) is highlighted, captioned “Tests: one proportion”.
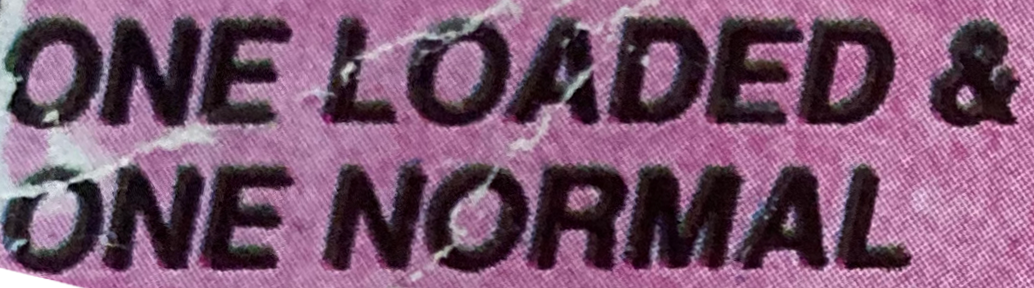
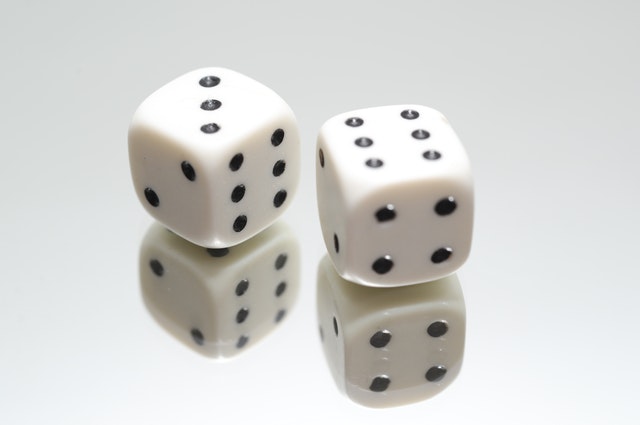
When in a toy store one day (for my children, of course), I saw ’loaded dice’ for sale (see image). The packaging claimed “one loaded & one normal”. I bought two sets! However, there was no indication as to which die was the loaded die. How could I determine which of the dice was loaded? That is, how could I make a decision about which die was loaded?
For a die that is not loaded, the population proportion of rolling any face of the die is \(p = 1/6\text{.}\) So, for example, the population proportion of rolls that show a ⚀ is \(p = 1/6\text{,}\) using the classical approach to probability. In any sample of rolls, however, the proportion of rolls showing a ⚀ would vary due to sampling variation, but would be approximately \(\hat{p} = 1/6\) with a fair die.
Suppose I rolled one die a certain number of times (say, \(n = 50\) times), then determined the value of the sample proportion \(\hat{p}\text{,}\) the sample proportion of rolls that show a ⚀. It is unlikely that the value of \(\hat{p}\) will be exactly\(1/6\) (the population proportion). If the observed value of \(\hat{p}\) was not exactly \(1/6\text{,}\) two possible reasons could explain this discrepancy between the value of the statistic and the assumed value of the parameter (Chap. Chapter 25):
I was rolling the fair die (with \(p = 1/6\)), and the discrepancy between the values of the population and sample proportions was simply due to sampling variation.
I was rolling the loaded die (with \(p \ne 1/6\)), and the discrepancy between the values of the population and sample proportion simply reflected this.
If I observed an unusually small or unusually large sample proportion of rolls that showed a ⚀, I would suspect that I had the loaded die: I was observing something unusual if I had rolled the fair die. This is exactly the decision-making process seen in Chap. Chapter 25.
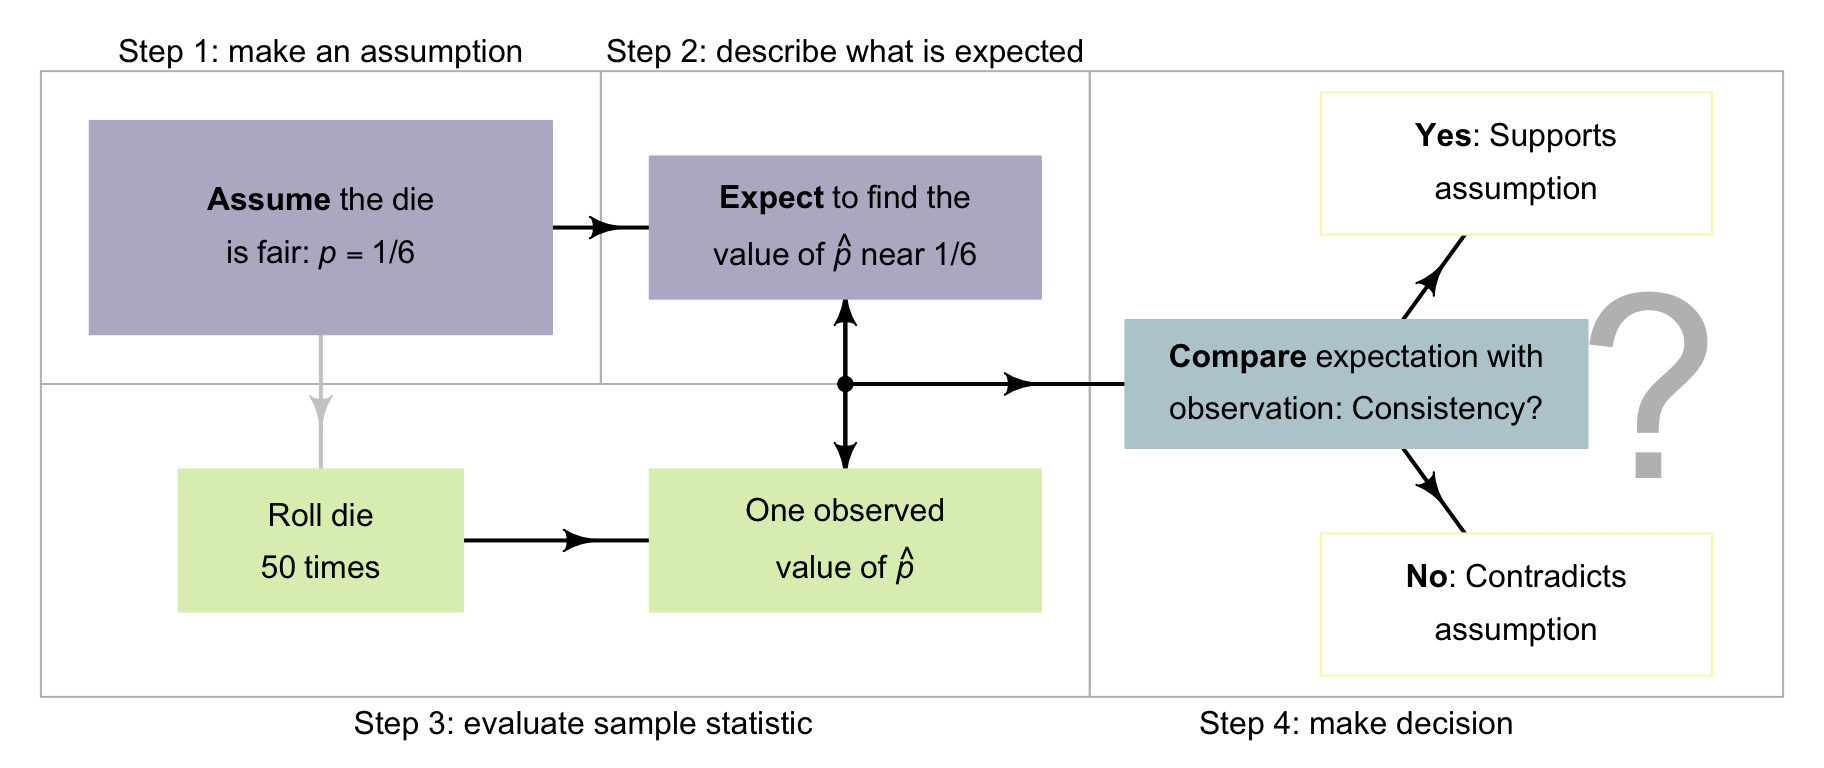
Make an assumption about the parameter: assume I have a fair die, so that \(p = 1/6\text{,}\) where \(p\) is the population proportion of rolls that show a ⚀.
Describe the expectations of the statistic: describe what value of the sample proportion \(\hat{p}\) could reasonably be expected from a fair die in \(50\) rolls.
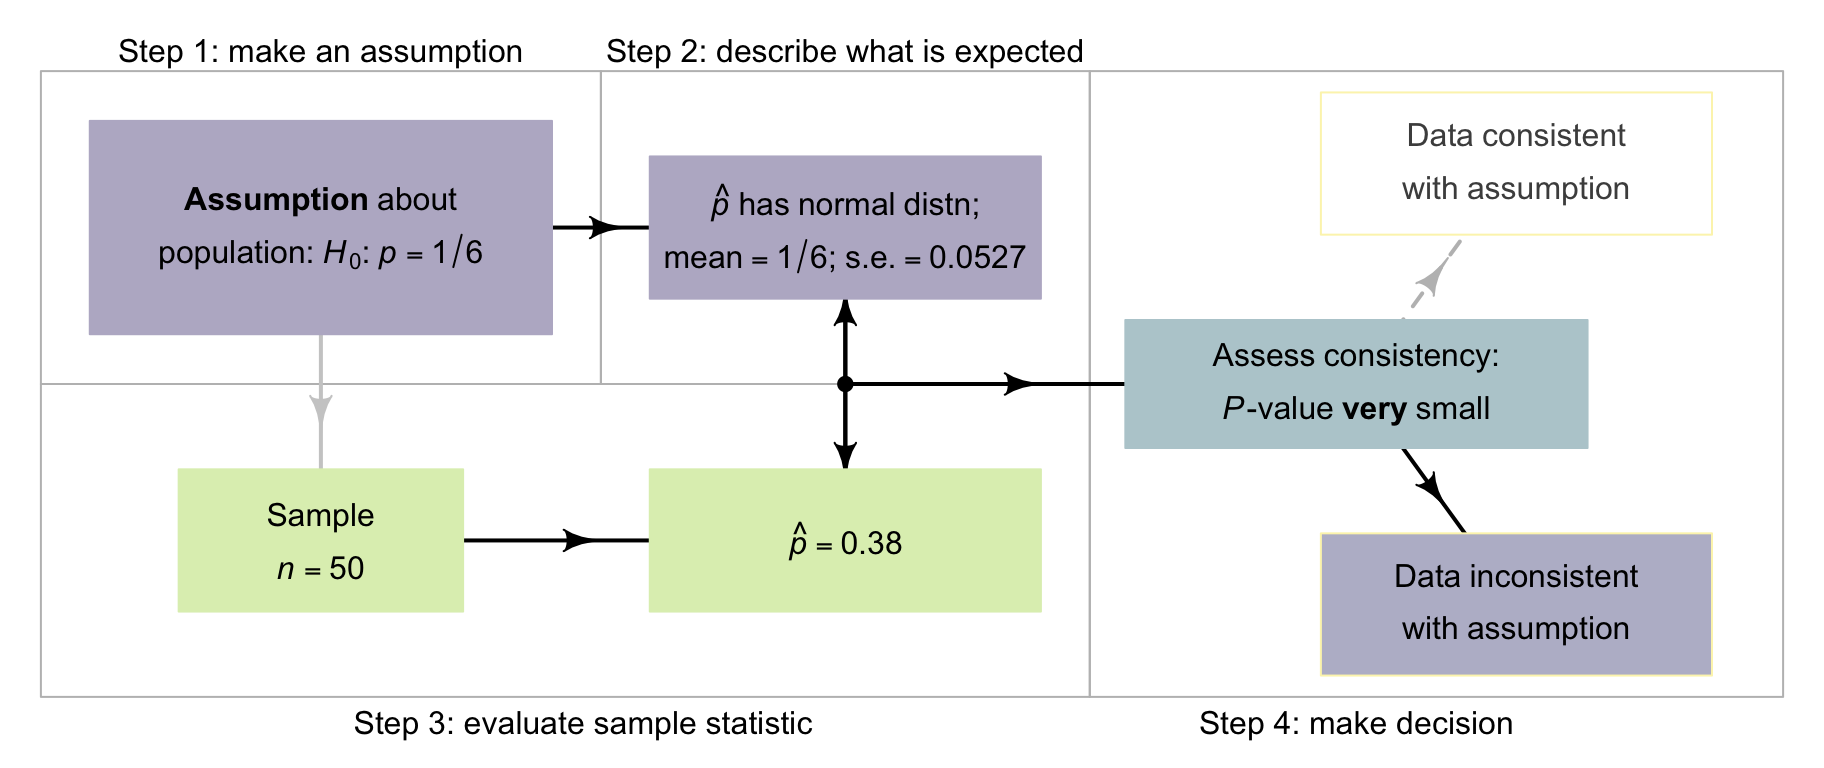
Using this decision-making process (Fig. Figure 26.1), I could decide if the die I had rolled seemed to be the fair die (based on rolling a ⚀; the die may be loaded in a different way, of course). For one specific die, I am asking the decision-making RQ:
When a fair, six-sided die is rolled \(50\) times, what proportion of the rolls will produce a ⚀? That is, what will be the value of the sample proportion\(\hat{p}\text{?}\) Of course, no-one knows, because the sample proportion will not be the same for every sample of \(50\) rolls. The sample proportion varies from sample to sample: sampling variation exists and is described by the sampling distribution.
Since many values for the sample proportion are possible, the values of the sample proportion vary (called sampling variation) and have a distribution (called a sampling distribution).
The sampling distribution of \(\hat{p}\) was described in Def. Definition 22.4 (and repeated in Def. Definition 26.5 below). The sample proportions are described by
Figure26.4.The proportion of rolls that show a ⚀, \(\hat{p}\text{,}\) is not the same for every sample of \(50\) rolls; it varies around a mean of \(p = 1/6\) (shown by the dot). The solid line is the normal distribution used to model the sampling distribution. The sampling distribution is an approximate normal distribution; it shows a model of how the proportion of rolls showing a ⚀ varies, when a die is rolled \(50\) times.
Definition26.5.Sampling distribution of a sample proportion with the population proportion known.
For a known value of \(p\text{,}\) the sampling distribution of the sample proportion is (when certain conditions are met; Sect. Section 22.7) described by
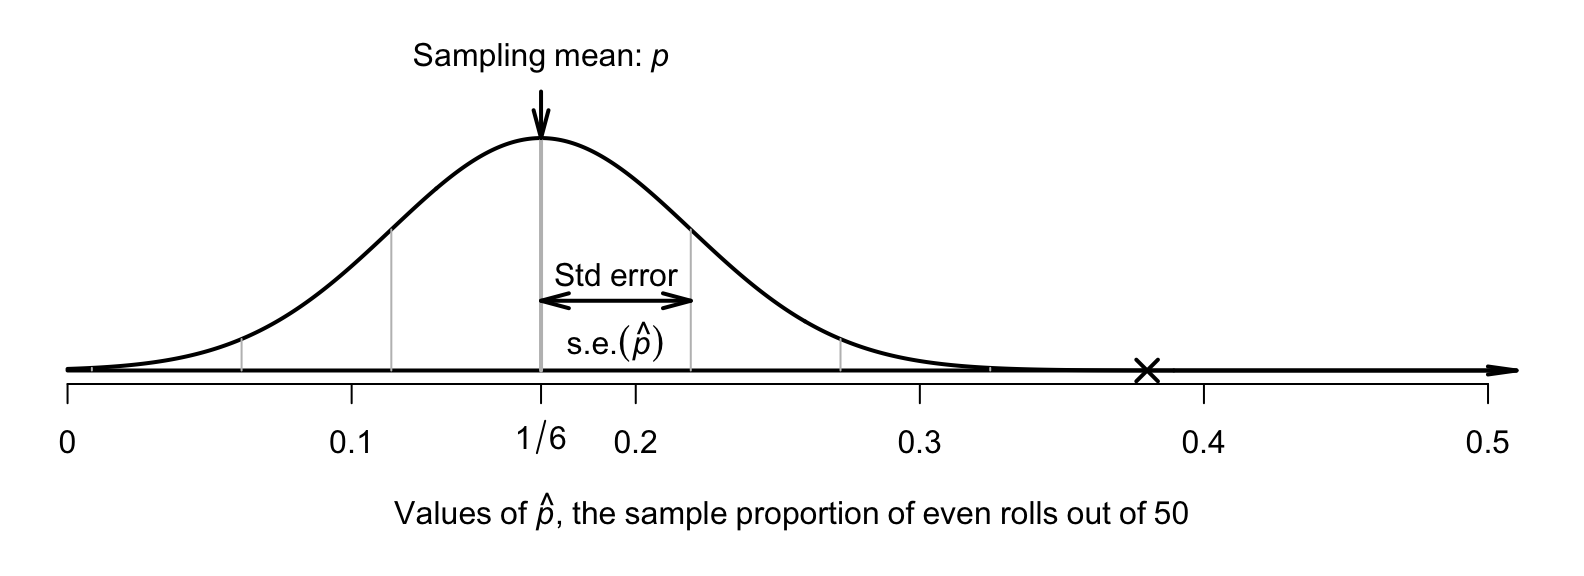
A picture of this normal distribution can be drawn (Fig. Figure 26.6); the standard error is the standard deviation of the normal distribution in Fig. Figure 26.6. While we still don’t know exactly what values of \(\hat{p}\) the next set of \(n = 50\) rolls will produce, we have some idea of how the sample proportion varies in samples of \(50\) rolls. For instance, values of \(\hat{p}\) greater than about \(0.35\) are unlikely to be observed from a fair die (with \(p = 1/6\)).
Figure26.6.The sampling distribution is an approximate normal distribution; it shows a model of how the proportion of rolls showing a ⚀ varies, when a die is rolled \(50\) times. The cross represents the observed sample proportion, \(\hat{p} = 0.38\text{.}\)
Figure Figure 26.6 shows what values of the sample proportion \(\hat{p}\) are expected when a fair die is rolled. Step 3 of the decision-making process (Fig. Figure 26.1) is to roll the die.
In this unusual or unexpected? Locating this value of \(\hat{p}\) on the sampling distribution in Fig. Figure 26.6 shows that a sample proportion of \(\hat{p} = 0.38\) is highly unusual from a fair die with \(p = 1/6\text{.}\) More specifically, since the sampling distribution has a normal distribution, a \(z\)-score can be computed:
\begin{equation*}
z
= \frac{\text{statistic} - \text{mean of the distribution}}{\text{std dev. of the distribution}}
= \frac{0.38 - (1/6)}{0.05270}
= 4.05,
\end{equation*}
which is a very large \(z\)-score (based on the \(68\)–\(95\)–\(99.7\) rule). Using a fair die, observing \(\hat{p} = 0.38\) would almost never occur. But I did observe \(\hat{p} = 0.38\text{,}\) which suggests that the die I was rolling was not the fair die.
I concluded that the die I was rolling was loaded (that is, \(p \ne 1/6\)). I may be incorrect (after all, it is not impossible to observe \(\hat{p} = 0.38\)), but the evidence is certainly persuasive. Using the decision-making process, a decision has been made about the die.
The process described above is called hypothesis testing. Hypothesis testing is used to make decisions about a population after observing just one of the countless possible samples. Formally, the hypothesis test above proceeds as described in the following sections.
Step 1 in the decision-making process is to make an assumption about the parameter. For the die example, the parameter is \(p\text{,}\) the population proportion of rolls that show a ⚀. The assumption is that \(p = 1/6\text{.}\) This is called the null hypothesis, denoted by \(H_0\text{:}\)
\begin{equation*}
\text{$H_0$: } p = 1/6.
\end{equation*}
The null hypothesis states the value of \(p\) is \(1/6\text{;}\) in other words, if the sample proportion \(\hat{p}\) is not equal to \(1/6\text{,}\) the discrepancy is explained by sampling variation. The null hypothesis is always the ’sampling variation’ explanation for the discrepancy between the values of the statistic and the parameter (Sect. Subsection 25.4.1).
The other explanation for why the value of the sample proportion \(\hat{p}\) is not equal to \(1/6\) is called the alternative hypothesis (denoted \(H_1\)), that the population proportion is not\(1/6\text{,}\) and this is the cause of the discrepancy between the values of the statistic and the parameter:
\begin{equation*}
\text{$H_1$: } p \ne 1/6.
\end{equation*}
These two hypotheses offer different explanations for the discrepancy between the values of the population proportion (the parameter) and the sample proportion (the statistic). The null hypothesis \(H_0\) states that \(p = 1/6\) and the discrepancy is due to sampling variation. The alternative hypothesis \(H_1\) states that \(p \ne 1/6\text{,}\) which explains the discrepancy.
Here, the RQ here is open to the value of \(p\) being smaller or larger than \(1/6\text{;}\) that is, two possibilities are considered. Hence, we write \(p \ne 1/6\text{,}\) which is called a two-tailed alternative hypothesis. Alternative hypotheses like \(p > 1/6\) (the population proportion is larger than \(1/6\)) or \(p < 1/6\) (the population proportion is smaller than \(1/6\)) are one-tailed hypothesis.
Section26.5Expectations: sampling distribution for \(\hat{p}\)
Step 2 in the decision-making process is to describe what values of the statistic (i.e., \(\hat{p}\)) could be expected under the assumption about the parameter (i.e., when the null hypothesis is true). Hypothesis testing always begins by assuming the null hypothesis is true.
The decision-making process begins by assuming the null hypothesis is true. Thus, the onus is on the data to refute the null hypothesis, the initial assumption.
Effectively, this step requires describing the sampling distribution of the statistic. For the die example, the sampling distribution for \(\hat{p}\) is (see Def. Definition 26.5):
Step 3 in the decision-making process is to evaluate the observations. As noted above, a ⚀ was observed in \(19\) of the \(50\) rolls, so \(\hat{p} = 0.38\text{.}\) Since the sampling distribution has a normal distribution, the corresponding \(z\)-score was computed as \(z = 4.05\text{,}\) which very large.
In hypothesis testing, the \(z\)-score is called the test statistic. The test statistic measures how far, in relative terms, the sample proportion is from the assumed value of the parameter.
Step 4 of the decision-making process is to use the information to make a decision: is the sample statistic consistent with what was expected under the assumption that \(p = 1/6\text{,}\) or does it contradict what was expected?
For the die example, the decision is reasonably easy: \(z = 4.05\) is very large and very unlikely to be observed if \(p = 1/6\text{.}\) This means the sample evidence contradicts what was expected if the assumption was true: persuasive evidence exists that the die is loaded.
More generally, evidence is evaluated using a \(P\)-value. \(P\)-values refer to the area more extreme than the calculated test statistic in the sampling distribution.
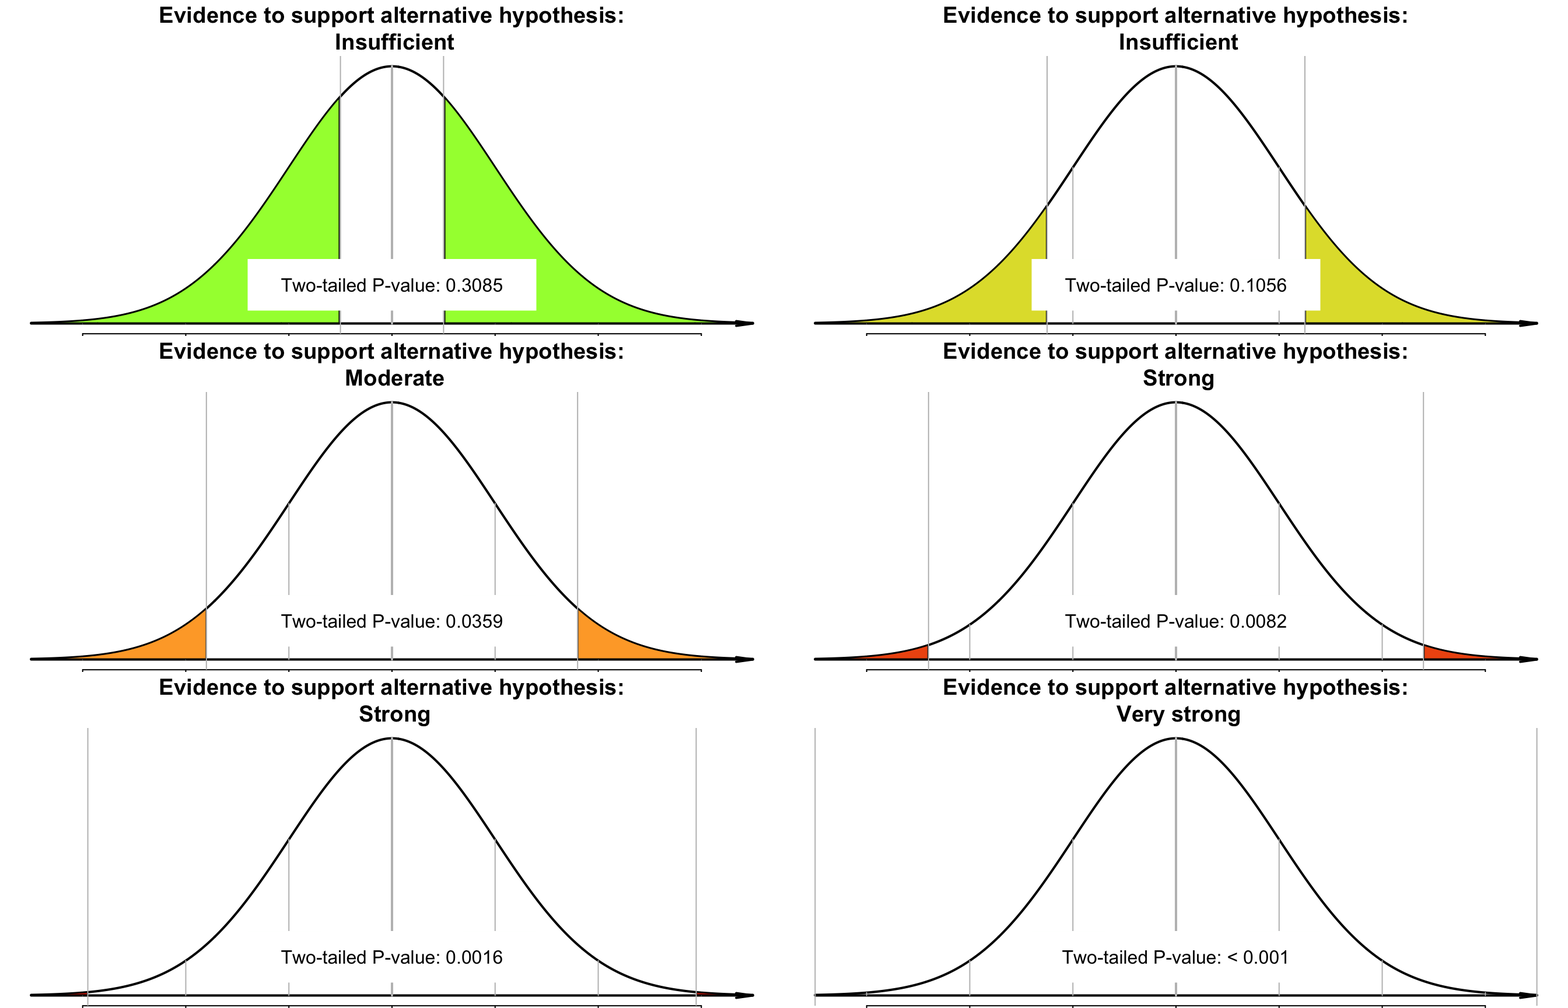
For this situation, where the sampling distribution has a normal distribution, \(P\)-values refer to the area more extreme than the calculated \(z\)-score (the statistic) in the normal distribution; that is, the area in the tails of the distribution (see Fig. Figure 26.9). This is a way to measure how unusual the calculated \(z\)-score is.
For two-tailed alternative hypotheses, the \(P\)-value is the combined area in the lower and upper tails that correspond to the positive and negative values of the test statistic. For one-tailed alternative hypotheses, the \(P\)-value is the area in one tail only. Clearly, since the \(P\)-value is a probability, its value is always between \(0\) and \(1\text{.}\)
Since the sampling distribution has a normal distribution in this example, \(P\)-values can be approximated using the \(68\)–\(95\)–\(99.7\) rule and a diagram (Sect. Section 20.5; Sect. Subsection 26.7.1), or more precisely using the \(z\)-tables in App. Section B.3 (Sect. Section 20.7; Sect. Subsection 26.7.2). \(P\)-values are also reported by software for most statistical tests.
Subsection26.7.1Approximating \(P\)-values using the \(68\)–\(95\)–\(99.7\) rule
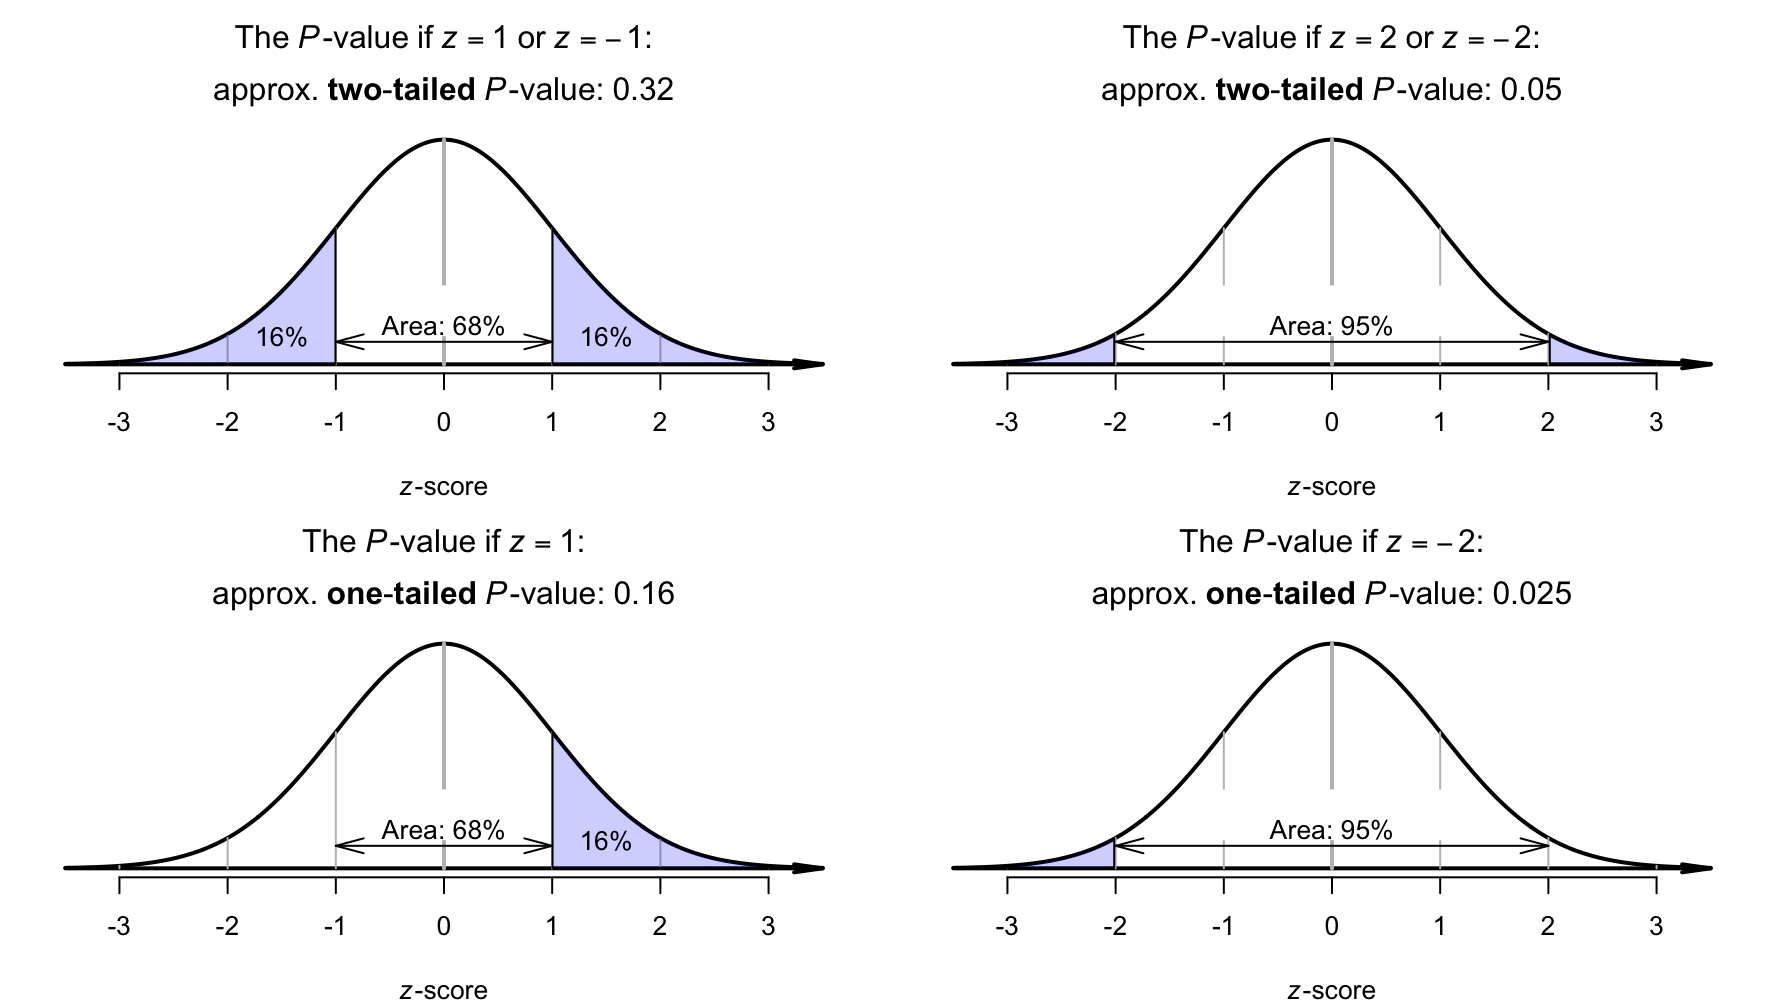
The \(68\)–\(95\)–\(99.7\) rule can be used to determine approximate\(P\)-values. To demonstrate, suppose the computed \(z\)-score was \(z = 1\text{.}\) Then, the two-tailed \(P\)-value is the shaded tail-area in Fig. Figure 26.9 (top left panel): about \(32\)%, based on the \(68\)–\(95\)–\(99.7\) rule. The two-tailed \(P\)-value would be the same if \(z = -1\) (as both tails are of interest). The one-tailed\(P\)-value would be the area in one-tail (Fig. Figure 26.9, bottom left panel): about \(16\)%, based on the \(68\)–\(95\)–\(99.7\) rule.
As another example, suppose the calculated \(z\)-score was \(z = -2\text{.}\) Then, the two-tailed \(P\)-value is the shaded area shown in Fig. Figure 26.9 (top right panel): about \(5\)%, based on the \(68\)–\(95\)–\(99.7\) rule. The two-tailed \(P\)-value would be the same if \(z = 2\text{.}\) The one-tailed\(P\)-value would be the area in one tail only (Fig. Figure 26.9, bottom right panel): about \(2.5\)%, based on the \(68\)–\(95\)–\(99.7\) rule.
Figure26.9.The two-tailed \(P\)-value is the combined area in the two tails of the distribution; the one-tailed \(P\)-value is the area in one tail only. Top left panel: if \(z = 1\) (or \(z = -1\)), the two-tailed \(P\)-value is approximately \(0.16\text{.}\) Top right panel: if \(z = 2\) (or \(z = -2\)), the two-tailed \(P\)-value is approximately \(0.05\text{.}\) The corresponding one-tailed \(P\)-values are half the two-tailed \(P\)-values, and are shown in the bottom panels.
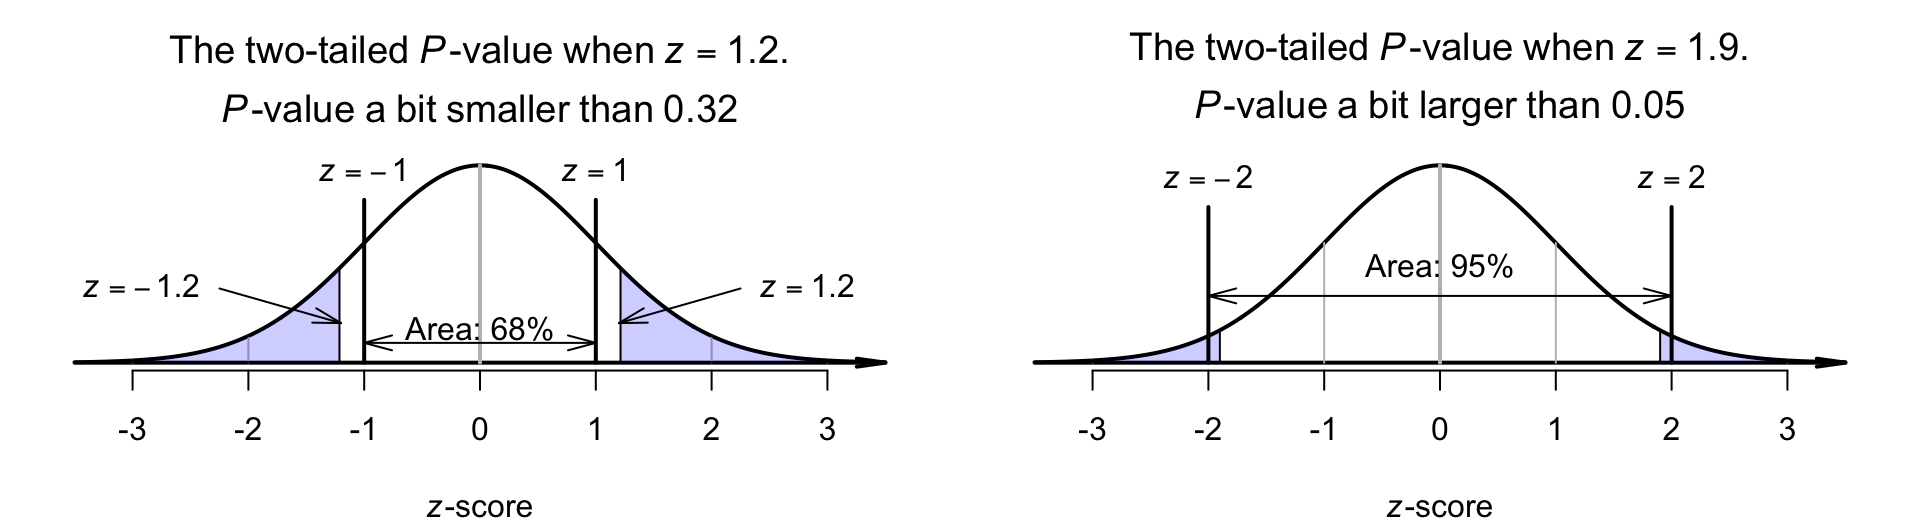
Of course, calculated \(z\)-scores are unlikely to be exactly \(z = 1\) or \(z = -2\text{.}\) Suppose the \(z\)-score is a little larger than \(z = 1\text{;}\) say \(z = 1.2\text{.}\) Then, the two-tailed area will be a little smaller than the tail area when \(z = 1\) (Fig. Figure 26.10, left panel). The two-tailed \(P\)-value is a little smaller than \(0.32\text{.}\)
Similarly, suppose the \(z\)-score is not quite equal to \(z = -2\text{;}\) say \(z = -1.9\text{.}\) Then, the two-tailed area will be a little larger than the tail area when \(z = -2\) (Fig. Figure 26.10, right panel). The two-tailed \(P\)-value is a little larger than \(0.05\text{.}\)
Figure26.10.The two-tailed \(P\)-value for \(z\)-scores not aligned with the \(68\)–\(95\)–\(99.7\) rule. Left panel: when \(z = 1.2\) (or \(z = -1.2\)). Right panel: when \(z = 1.9\) (or \(z = -1.9\)).
Subsection26.7.2More precise \(P\)-values using tables
Using the tables of areas under normal distributions (App. Section B.3), more precise \(P\)-values can be found using the ideas from Sect. Section 20.6. For instance (see Fig. Figure 26.10):
for \(z = 1.2\text{:}\) the area to the left of \(z = -1.2\) is \(0.1151\text{,}\) and the area to the right of \(z = 1.2\) is \(0.1151\text{,}\) so the two-tailed\(P\)-value is \(0.1151 + 0.1151 = 0.2302\text{.}\) This is a little smaller than \(0.32\text{,}\) as estimated above.
for \(z = 1.9\text{:}\) the area to the left of \(z = -1.9\) is \(0.0287\text{,}\) and the area to the right of \(z = 1.9\) is \(0.0287\text{,}\) so the two-tailed\(P\)-value is \(0.0287 + 0.0287 = 0.0574\text{.}\) This is a little larger than \(0.05\text{,}\) as estimated above.
In this die-rolling example, where \(z = 4.05\text{,}\) the tail area is very small (using App. Section B.3), and zero to four decimal places. \(P\)-values are never exactly zero, so we write \(P < 0.0001\) (that is, the \(P\)-value is less than\(0.0001\)).
\(P\)-values tells us the probability of observing the sample statistic (or a value even more extreme), assuming the null hypothesis is true. In the die-rolling example, the \(P\)-value is the probability of observing the value of \(\hat{p} = 0.38\) (or a more extreme value), just through sampling variation if \(p = 1/6\text{.}\) Then (see Fig. Figure 26.11):
’big’ \(P\)-values mean the sample statistic (i.e., \(\hat{p}\)) could reasonably have occurred through sampling variation in one of the many possible samples, if the assumption made about the parameter (stated in \(H_0\)) was true; the data do not contradict the assumption in \(H_0\text{.}\) There is no persuasive evidence to support the alternative hypothesis.
’small’ \(P\)-values mean the sample statistic (i.e., \(\hat{p}\)) is unlikely to have occurred through sampling variation in one of the many possible samples, if the assumption made about the parameter (stated in \(H_0\)) was true; the data do contradict the assumption in \(H_0\text{.}\) There is persuasive evidence to support the alternative hypothesis.
Figure26.11.The strength of evidence: \(P\)-values. As the \(z\)-score becomes larger, the \(P\)-value becomes smaller, and it is more likely that the evidence contradicts the null hypothesis.
What is meant by ’small’ and ’big’ in this context? What represents persuasive evidence to support the alternative hypothesis? A \(P\)-value smaller than \(5\)% (or \(0.05\)) is usually considered ’small’, and persuasive evidence to support the alternative hypothesis. In contrast, a \(P\)-value larger than \(5\)% (or \(0.05\)) is usually considered ’big’, and not persuasive evidence to support the alternative hypothesis.
Rather than having an arbitrary boundary between ’big’ and ’small’, a more sensible approach is to qualify the strength of the evidence that supports the alternative hypotheses (discussed further in Sect. Section 28.6).
In this die-rolling example, where the \(P\)-value is very small, the data contradict the null hypothesis that \(p = 1/6\text{:}\) the evidence supports the alternative hypothesis that \(p \ne 1/6\text{.}\) This suggests that the die is very likely not fair.
Be careful interpreting the results! We cannot be sure that the die is unfair. A small \(P\)-value is not proof that the die is loaded. The die may be fair but, due to sampling variation, the sample we observed may simply have produced an unusually high proportion of rolls that show a ⚀ by chance.
The result is interpreted as ’there is strong evidence that the die is unfair’. Remember: the onus is on the data to refute the null hypothesis, the initial assumption.
In the die example, suppose we found the two-tailed \(P\)-value as \(0.26\text{.}\) This is ’large’ (i.e., much larger than \(0.05\)). Then the observed value of \(\hat{p}\) could easily be explained by chance, and is not persuasive evidence to support the alternative hypothesis (that the die is unfair). There is no persuasive evidence that \(p\) is not \(1/6\text{.}\)
The sample provides strong evidence (\(z = 4.05\text{;}\) two-tailed \(P < 0.001\)) that the proportion of rolls that show a ⚀ is not \(1/6\) (\(\hat{p} = 0.38\text{;}\) approx. \(95\)% CI: \(0.243\) to \(0.517\text{;}\)\(n = 50\) rolls) in the population.
Since the null hypothesis is initially assumed to be true, the onus is on the evidence to refute the null hypothesis. That is, we retain the null hypothesis unless there is persuasive evidence to stop doing so. Hence, conclusions are worded in terms of how strongly the evidence (i.e., sample data) supports the alternative hypothesis.
The alternative hypothesis may or may not be true, but we report how strongly the evidence (data) supports the alternative hypothesis. Conclusions are not worded in terms of how much evidence supports the null hypothesis.
Assumption. Write the null hypothesis and alternative hypothesis about the parameter (based on the RQ), where \(p\) is the population proportion of rolls that are a ⚀:
Expectation. The sampling distribution describes what values to reasonably expect from the sample statistic across all possible samples, if the null hypothesis is true. In this situation, the sampling distribution has an approximate normal distribution.
Observation. Compute the \(z\)-score (\(z = 4.05\)), a measure of the discrepancy between the assumed population value, and the observed sample value. This is a very large value.
Decision. Determine if the data are consistent with the assumption, by computing the \(P\)-value. Here, the two-tailed \(P\)-value is (much) less than \(0.0001\text{,}\) so strong evidence exists that \(p\) is not\(1/6\text{.}\)
The hypothesis test conducted in this chapter assumes the sampling distribution is approximately a normal distribution (and so, for example, the \(68\)–\(95\)–\(99.7\) rule can be applied). This is only true if certain conditions are met.
The statistical validity conditions for a test for a single proportion is that the expected number of individuals in the group of interest (i.e, \(n\times p\)) and in the group not of interest (i.e., \(n\times (1 - p)\)) both exceed five; that is:
The value of \(5\) here is a rough figure; some books give other values (such as \(10\)). This condition ensures that the sampling distribution of the sample proportions has an approximate normal distribution (so that, for example, the \(68\)–\(95\)–\(99.7\) rule can be used). The units of analysis are also assumed to be independent (e.g., from a simple random sample). For a test for one proportions, these conditions are similar to those for the CI for one proportion (Sect. Section 22.1).
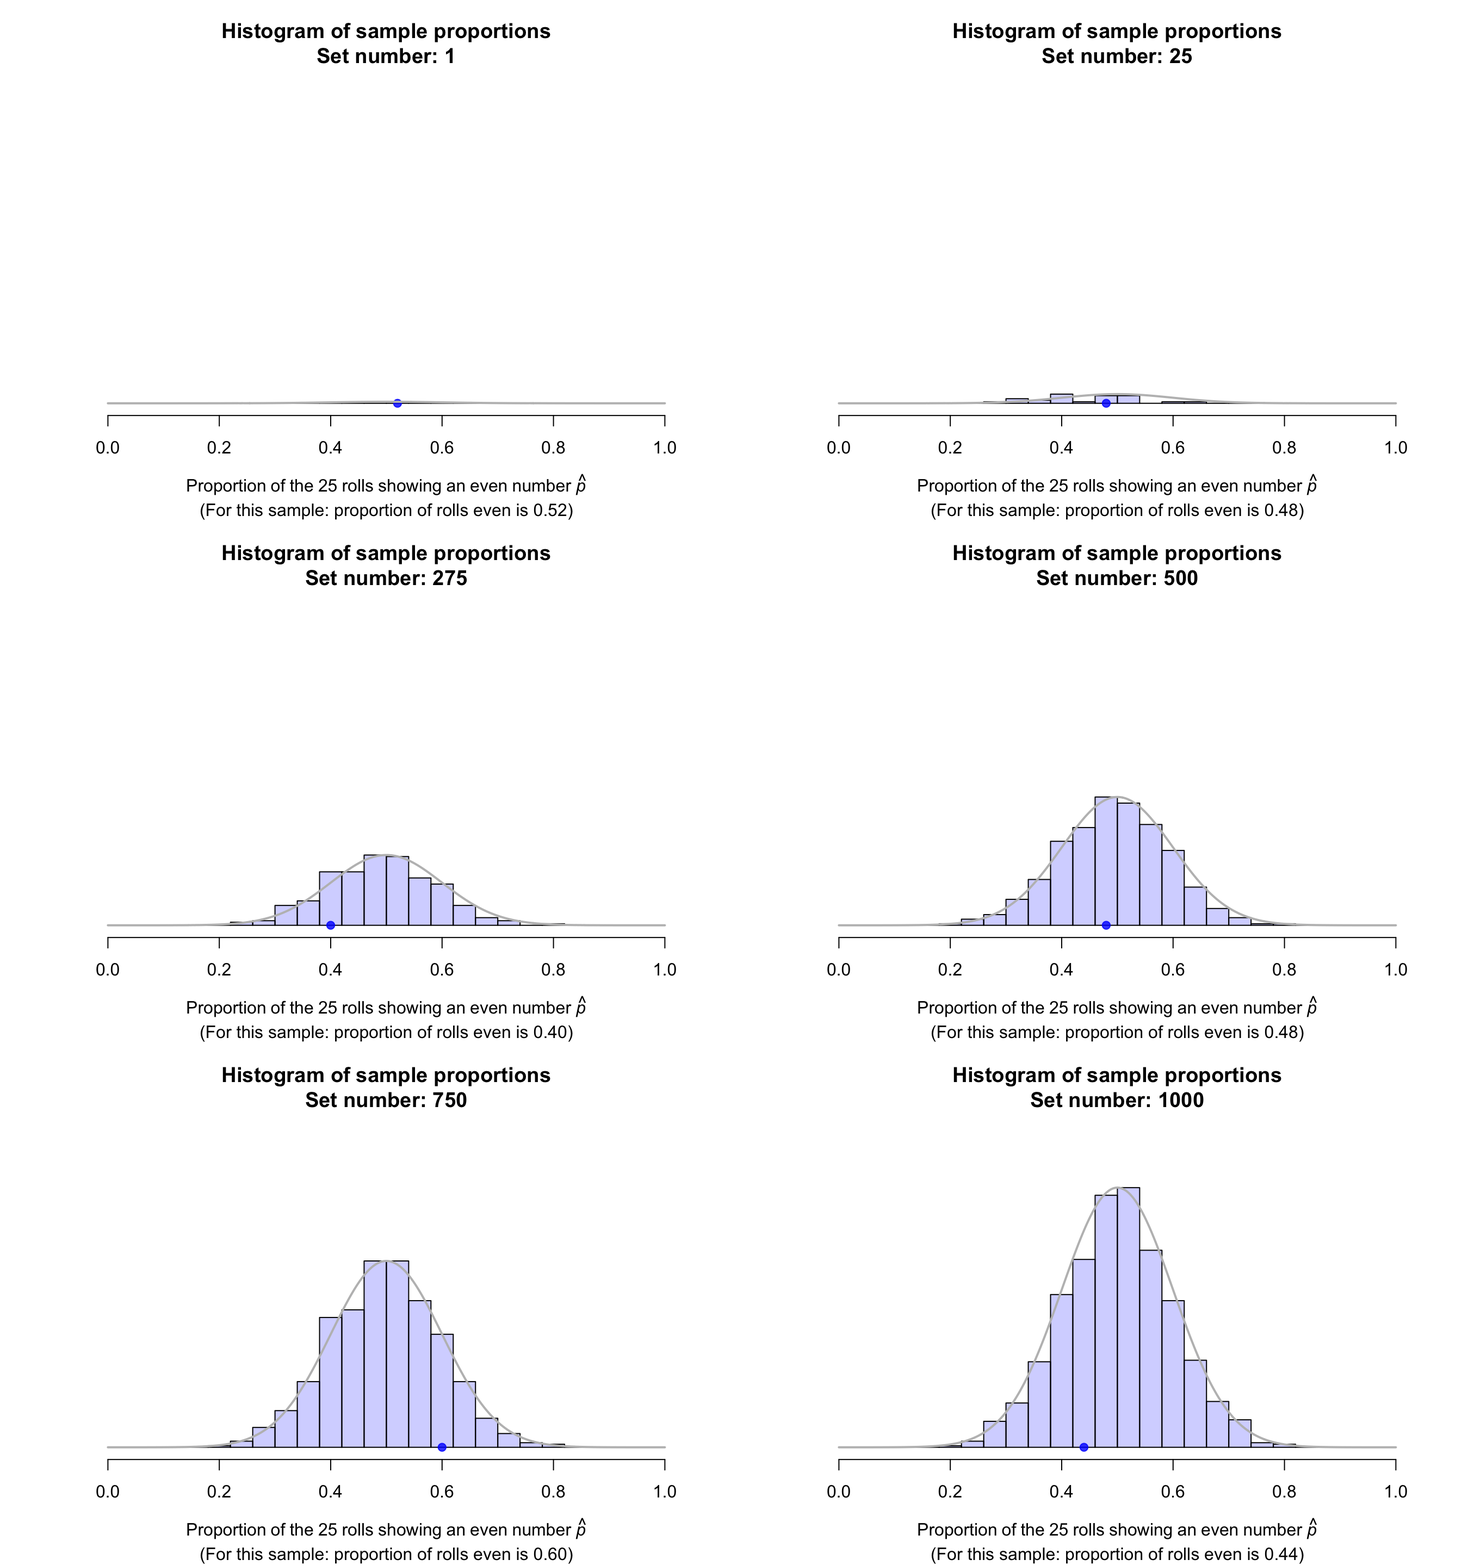
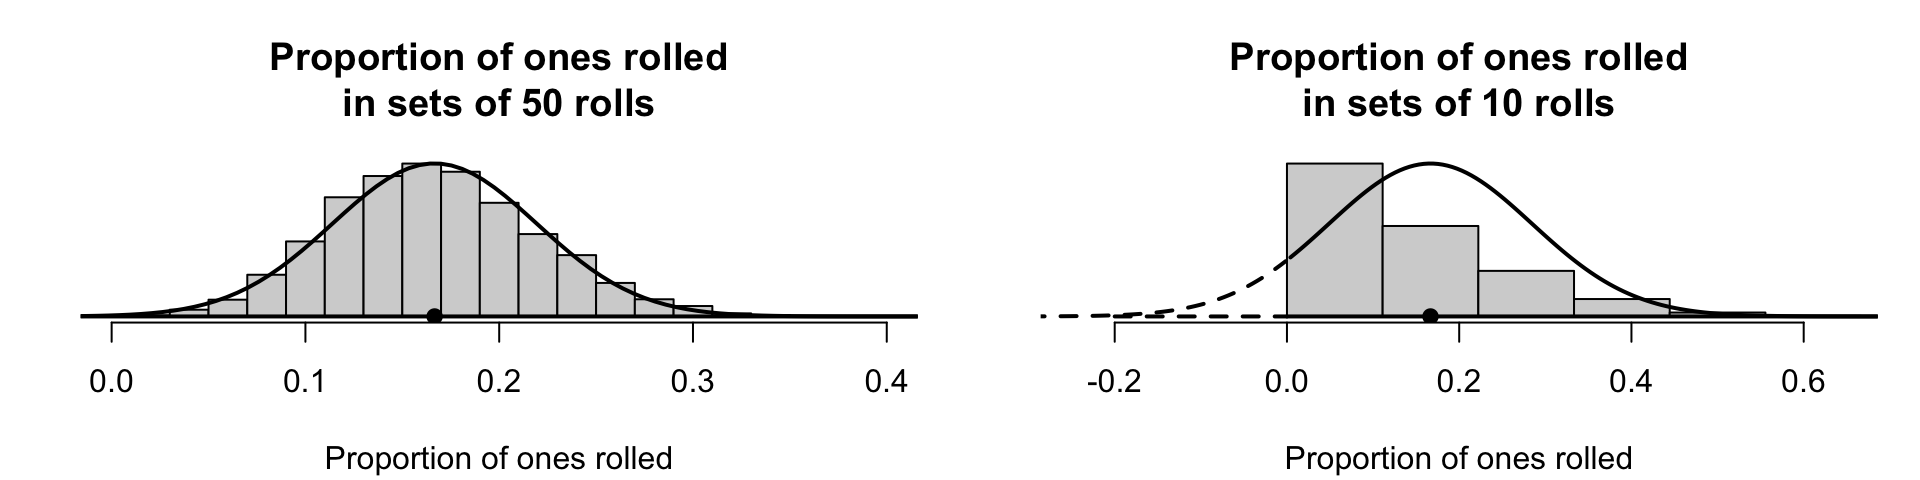
The hypothesis test regarding the dice is statistically valid. Firstly, \(n\times p = 50 \times (1/6) = 8.666\dots\) (i.e., expect about \(8.7\) rolls to show a ⚀), and \(n\times (1 - p) = 41.666\dots\) (i.e., expect about \(41.7\) rolls to not show a ⚀). Both comfortably exceed five, so the normal distribution will be a good approximation for the sampling distribution. This is what we observe from a computer simulation (Fig. Figure 26.19, left panel).
Suppose the die was rolled \(10\) times rather than \(50\) times. Then, \(n\times p = 10 \times (1/6) = 1.666\dots\) and \(n\times (1 - p) = 10 \times (1 - 1/6) = 8.333\dots\text{.}\) These do not both exceed five, so the normal distribution may be a poor approximation for the sampling distribution.
This is what we observe from simulating the situation (Fig. Figure 26.19, right panel). The normal model is poor: the simulation shows that the sample proportions are not even symmetrically distributed.
Figure26.19.The sampling distributions for two situations for rolling a die. Left: for sets of 50 rolls, the sampling distribution does have an approximate normal distribution. Right: for sets of \(10\) rolls, the sampling distribution does not have a normal distribution. The solid lines show the approximate normal distributions, and the histograms show the simulated distribution of the sample proportions over many sets of rolls. The solid dots are the value \(p = 1/6\text{,}\) the population proportion of rolls that show a ⚀.
In \(50\) rolls of the other die, I found a ⚀ on \(7\) rolls, so that \(\hat{p} = 7/50 = 0.14\text{.}\) To determine if this die appears loaded, the hypotheses are the same as before:
\begin{equation*}
\text{$H_0$: } p = 1/6 \qquad\text{and}\qquad \text{$H_1$: } p \ne 1/6.
\end{equation*}
Following the procedures above (check!) and using the same hypotheses, \(z = -0.506\) and (using tables) the two-tailed \(P\)-value is \(2\times 0.3061 = 0.6122\text{.}\) This means that the sample result was not unusual if \(p = 1/6\text{,}\) and is certainly not persuasive evidence to support the alternative hypothesis. There is no evidence to suggest the second die is loaded.
A large \(P\)-value does not prove that the die is fair! It only means that the proportions of rolls that produce a ⚀ is not unusual... but perhaps the die is loaded in some other way (i.e., to produce more-than-expected rolls of a ⚄).
A large \(P\)-value does not necessarily mean that the die is fair! The die may indeed be loaded to produce a larger-than-expected numbers of rolls that show a ⚀, but (due to sampling variation) the sample we observed simply did not provide evidence to make that conclusion.
The result is interpreted in terms of how much evidence exists to support the alternative hypothesis. The onus is on the data (i.e., evidence) to refute the assumption made in the null hypothesis.
[185] compared two types of birds (male green-backed tits; male cinereous tits) to see which was more behaviourally dominant over winter. If the species were equally-dominant, then about \(50\)% of the interactions would be won by each species. If we define \(p\) as the proportion of interactions won by green-backed tits, then we would expect \(p = 0.50\text{.}\) However, in the \(45\) interactions observed between the two species, green-backed tits won \(37\) interactions (i.e., \(\hat{p} = 37/45 = 0.82222\)). A discrepancy exists between the sample proportion (\(\hat{p} = 0.8222\)) and the expected population proportion \(p = 0.50\text{.}\)
Of course, different sample of \(45\) interactions would produce different values of \(\hat{p}\text{.}\) To test if the population proportion of interaction wins could be equally shared, the hypotheses are:
This is a very large \(z\)-score, so the \(P\)-value will be very small, using the \(68\)–\(95\)–\(99.7\) rule, or using tables. This is persuasive evidence to support the alternative hypothesis. We write:
Very strong evidence exists in the sample (\(P < 0.0001\text{;}\)\(z = 4.325\)) that the interactions were not won equally by each species (\(\hat{p} = 0.8222\) won by green-backed tits; approx. \(95\)% CI: \(0.708\) to \(0.936\text{;}\)\(n = 45\)) in the population.
Write the null hypothesis (\(H_0\text{;}\) the sampling variation explanation) and the alternative hypothesis (\(H_1\)); initially assume the value of \(p\) in the null hypothesis to be true.
Describe the sampling distribution, which describes what to expect from the sample statistic across all possible samples, based on this assumption: under certain statistical validity conditions, the sample mean varies with:
with a standard deviation of \(\displaystyle \text{s.e.}(\hat{p}) = \sqrt{\frac{p \times (1 - p)}{n}}\text{,}\) where \(p\) is the hypothesised value given in the null hypothesis, and \(n\) is the sample size.
Compute an approximate \(P\)-value using the \(68\)–\(95\)–\(99.7\) rule, or using tables. Use the \(P\)-value to make a decision, and write a conclusion.
A study of diseases in Native Americans [343] found \(381\) obese or overweight patients in \(449\) patients. Across all the US population, the percentage obese or overweight was \(65\)%. The researchers wanted to determine if the percentage of obesity/overweight Native Americans was greater than that of the general population.
In the die example, the observed proportion is \(0.38\text{.}\) Could we simply state that the proportion clearly is not \(1/6 = 0.1666\text{?}\) Explain.
[98] studied if subjects could identify potential placebos at a better rate than just guessing. The \(81\) subjects were each presented with a choice of five different supplements, four of which were placebos. Subjects were asked to select which one was the legitimate herbal supplement based on the taste; \(50\) subjects correctly selected the true herbal supplement.
If the subjects were selecting the true herbal supplement randomly, what proportion of subjects would be expected to select the correct supplement as the true herbal medicine?
[273] studied the measles-rubella vaccination-rates in Korea, comparing the proportion of children susceptible to measles with the World Health Organization target proportion (for children aged \(5\) to \(9\) years old: \(10\)%).
The aim was to test if the proportion of Korean children susceptible to measles in the population was \(10\)% or lower (i.e., better). In the study, \(55\) children out of \(972\) were susceptible to measles.
[308] studied western saw-shelled turtles. When eggs were incubated at \(27\)^o^C, they observed that \(29\) males and \(44\) females hatched. Are the proportions of male and female turtles that hatch at this temperature equal?
[Dataset: PremierL] In the 2019/2020 English Premier League (EPL), the home team won \(91\) games, and the away team won \(67\) games. (Another \(50\) games were draws.)
Use the \(n = 158\) games with a result to determine if there is evidence that the home team wins more often than \(50\)% (i.e., that there is a home-side advantage).
[283] introduced pedal machines on the first floor of the Joyner Library for use by students at East Carolina University (ECU) to increase activity in library users. At ECU, \(60.2\)% of all students were females (i.e., in the population). Students were observed using the machine on \(589\) occasions, of which \(295\) times were by females
Is there evidence that the proportion of female users of the machines was lower than the overall female proportion at the university? What would you conclude?
[275] found that \(88\) of the \(357\) visitors to Las Vegas casinos in 1995 were smokers. At the time, \(25.5\)% of the general US population were smokers (based on data from the US National Center for Health Statistics). Is the proportion of smokers among casino-goers the same as for the general US population?
[292] developed gluten-free pasta made from breadfruit. In the study sample, \(57\) of the \(71\) participants stated that they liked the pasta. Do the researchers have sufficient evidence to claim that the ’majority of people like breadfruit pasta’?
Carpal Tunnel Syndrome (CTS) is a painful condition in the wrists. [190] were interested in whether ’a relationship exists between the palmaris tendon [and] carpal tunnel syndrome (CTS)’ (p. 493). The palmaris longus (PL) tendon is visually absent in about \(15\)% of the population. The researchers found PL was visually absent in \(33\) of \(516\) CTS wrists in their sample. Is there evidence to suggest that rate of PL absence is different in CTS cases, compared to the general population?
Researchers aimed to estimate the frequency of resistance to the toxin in the corn. By mating borers collected from the field with various resistant laboratory individuals, they could determine what proportion of resistant individuals to expect in the second generation offspring. In one study of \(n = 172\) second-generation individuals, \(24\) were found to be resistant. The theoretical expectation was that \(1\)-in-\(16\) of the second-generation borers would be resistant if the field borers were resistant. Perform a hypothesis test to determine if the data suggest that the field borers were resistant (that is, if the population proportion is \(1/16\)) as expected.
[240] studied street-light preferences of drivers. Drivers were asked to conduct a series of manoeuvres under \(3\,000\)K LED light and then under \(4\,000\)K LED lights. They were then asked to decide which street light they preferred. Out of the \(52\) subjects, \(29\) preferred the \(3\,000\)K LED lights. Is there evidence that the choice between the two street lights is random, or is there evidence of a preference for one over the other?
The euro was introduced as a currency on 01 January 1999. According to a report by the New Scientist, students in Poland spun a Belgian one-euro coin \(250\) times, and found \(140\) heads (as reported by [217]). This resulted in an ’accusation of bias’ in the New Scientist article. However, every set of \(250\) spins can produce a different proportion of heads, so perhaps the results is just due to randomness. Does this sample of \(250\) spins suggest that the one-euro Belgian coin is biased?
The value of \(105.5\) is effectively a population odds ratio of male-to-female births. Show that this is equivalent to the population proportion of male births as \(0.51338\) (not including ’other’ or ’not stated’).
In 2021, there were \(148\,636\) male births and \(140\,944\) female births. Compute the sample proportion of male births in 2021 (to five decimal places).