Chapter29Mean differences (paired data): CIs and tests
Objectives
You have learnt to ask an RQ, design a study, classify and summarise the data, construct confidence intervals, and conduct hypothesis tests. In this chapter, you will learn to:
A diagram showing the six steps of research, arranged in a cycle: Ask, Design, Collect, Classify and summarise, Analyse, Report. Step 5 (Analyse) is highlighted, captioned “CIs and tests: mean differences”.
The six-minute walk test (6MWT) measures how far subjects can walk in six minutes, and is used as a simple, low-cost evaluation of fitness and other health-related measures. The recommended setting for the test is usually a walkway of at least \(30\ms\text{.}\)[300] measured the 6MWT distance when the same subjects used both\(20\ms\) and \(30\ms\) walkways.
The comparison is within individuals (Sect. Section 2.4); this is a repeated-measures study. Each subject has a pair of 6MWT measurements, and the study produced paired data (below),
Table29.1.The six-minute walk test (6MWT) distance, for walkways of \(20\ms\) and \(30\ms\) length. These are the first five and the last five of the \(50\) total observations. (A negative difference means the \(20\ms\) distance is greater than the \(30\ms\) distance.)
Some differences are negative. This does not mean a negative distance. Since the differences are computed as the \(30\ms\) distance minus the \(20\ms\) distance, a negative difference means the \(20\ms\) distance is a larger value than the \(30\ms\) distance.
are paired. Computing the differences or changes between the pairs of observations makes sense, since the values for each pair belong to the same unit of analysis (the same person, in this case).
Pairing data, when appropriate, is useful because individuals can vary substantially, and pairing means that extraneous variables (potentially, confounding variables) are held constant for those paired observations. For example, each pair of measurements in
Pairing is a form of blocking (Sect. Section 7.2). Pairing is a good design strategy when the individuals in the pair are the same, or are very similar, for many extraneous variables. (For example, the pair may comprise two different people, of the same sex, with similar age, height and weight.) Pairing often involves taking two measurements from the same individuals, as in
heart rate is measured for each twin in a pair (the twin-pair is the ’individual’), one of whom exercises regularly and one who does not. Pairing the twins is reasonable, given the shared genetics (and probably childhood environments also).
the body temperature of dogs (the ’individuals’) is measured using both rectal and ear thermometers for each dog. The difference between the two recorded temperatures from the thermometers for each dog is recorded.
blood pressure is recorded from some individuals (Group A) after receiving Drug A, and from another group of individuals (Group B) after receiving Drug B. Each person in Group A is matched with someone in Group B of the same sex, similar age and similar weight (e.g., in one of the pairs, both individuals are male, about \(30\) years-of-age, and weighing about \(95\kgs\)). The difference between the blood pressure measurements for the individual in Group A and the matched person in Group B is recorded for each pair.
the number of campers is recorded at many national parks (the ’individuals’) on the first weekend in summer, and on the first weekend in winter. The difference in camper numbers for each national park between these time points is recorded.
Many of these examples can be extended to beyond two measurements. For instance, temperatures can be compared on each dog using three different types of thermometers. In this chapter, only pairs of measurements are studied, and only for quantitative variables.
For the 6MWT study, the distance is measured for the same subjects for two different walkway distances. Each subject receives two measurements, and the difference between the distances walked for each individual is computed.
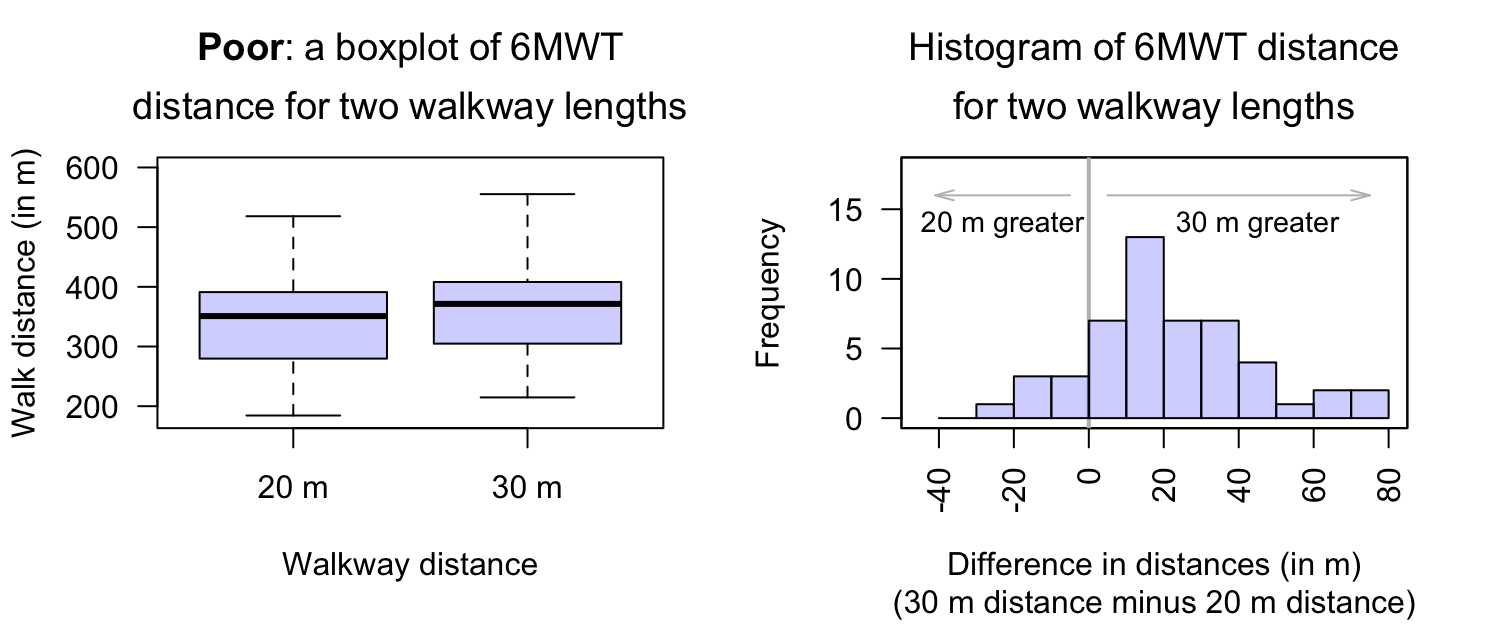
Since the data are paired, an appropriate graph is a histogram of the differences (Sect. Subsection 13.3.1); specifically, \(30\ms\) distance minus the \(20\ms\) distance. A boxplot comparing 6MWT distance for both walkway lengths (that is, not pairing the data) shows the distribution of distances, and the median distances, are very similar (Fig. Figure 29.23, left panel). Any difference in individuals’ 6MWT distances is difficult to see and detect. In addition, linking the \(20\ms\) and \(30\ms\) distances that belong together for each individual patient is not possible.
However, using a histogram of the differences makes the individuals’ differences easier to see (Fig. Figure 29.23, right panel). The histogram also makes it easy to see that some subjects walked further with a \(20\ms\) walkway, and some further for a \(30\ms\) walkway. Individually graphing the distances for both walkway distances may also be useful too (e.g., using two histograms), but a graph of the differences is crucial, as the RQ is about those differences. A case-profile plot (Sect. Subsection 13.3.2) is also appropriate, but is difficult to read for these data because sample size is large (a line is needed for each of the \(50\) units of analysis).
The 6MWT distances for each walkway length can be summarised individually (the first two rows of Table Table 29.4) using the methods of Chap. Section 23.1, using software (Fig. Figure 29.24). All statistics are slightly different for the two walkway distances; in particular, the mean \(30\ms\) walkway distance is slightly larger. However, since the RQ is about the difference between the distances, a numerical summary of the differences is essential (third row of Table Table 29.4, based on Fig. Figure 29.24). Notice that the third row of information is computed from the values in the Diff. column in
For Thai patients with chronic obstructive pulmonary disease, what is the mean difference between the 6MWT distance when subjects use a \(20\ms\) walkway and a \(30\ms\) walkway?
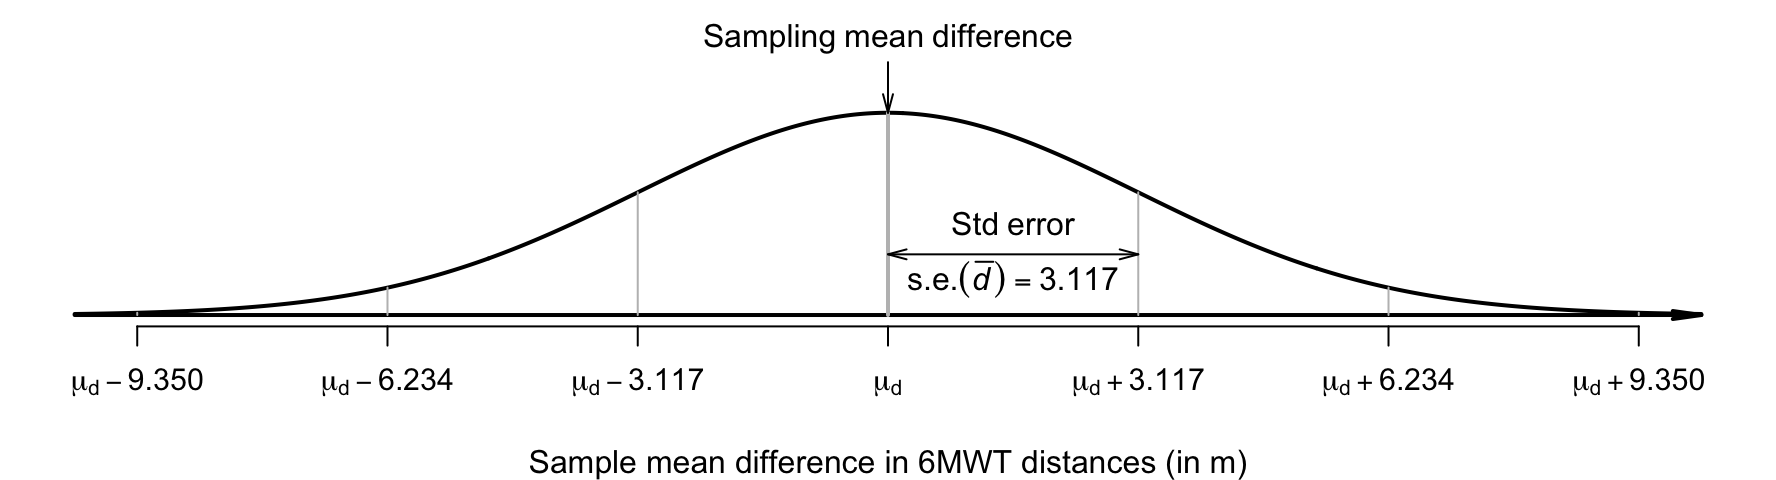
Every possible sample of \(n = 50\) subjects comprises different people, and hence produces different 6MWT distances for \(20\ms\) and \(30\ms\) walkways. For this reason, the 6MWT distance summaries in Table Table 29.4 include standard errors. Since the 6MWT distance varies from sample to sample for each person, the differences between the distances for each person varies from sample to sample too, and also have a sampling distribution.
Figure29.7.The sampling distribution is a normal distribution; it describes how the sample mean difference between the 6MWT distances varies in samples of size \(n = 50\text{.}\)
As usual when the sampling distribution has an approximate normal distribution, an approximate \(95\)% CI uses the approximate multiplier of \(2\) (from the \(68\)–\(95\)–\(99.7\) rule). This is the same as the CI for \(\bar{x}\) if the differences are treated as the data.
or \(22.03\pm 6.234\ms\) (so the margin of error is \(6.234\ms\)). Equivalently, the CI is from \(22.03 - 6.234 = 15.796\ms\text{,}\) up to \(22.03 + 6.234 = 28.264\ms\text{.}\) We write:
The mean difference in the 6MWT distances when using a \(20\ms\) and \(30\ms\) walkway is \(22.03\ms\) (\(\text{s.e.} = 3.117\text{;}\)\(n = 50\)), with an approximate \(95\)% CI from \(15.80\ms\) to \(28.26\ms\text{,}\) further for a \(30\ms\) walkway.
The CI means that the reasonable values for the population mean difference in 6MTW distances are between \(15.80\ms\) and \(28.26\ms\text{.}\) Alternatively, we are \(95\)% confident that the population mean difference between the 6MWT distances is between \(15.80\ms\) and \(28.26\ms\) (further for \(30\ms\) walkway). A difference of this magnitude probably has practical importance. Also notice that the direction of the difference is given: ’further for \(30\ms\) walkway’.
Statistical software produces exact\(95\)% CIs, which may be slightly different from the approximate\(95\)% CI (recall: the \(68\)–\(95\)–\(99.7\) rule gives approximate multipliers). For the 6MWT data, the approximate and exact\(95\)% CIs are the same to one decimal place (Fig. Figure 29.24). We write:
The mean difference in the 6MWT distances when using a \(20\ms\) and \(30\ms\) walkway is \(22.03\ms\) (\(\text{s.e.} = 3.117\text{;}\)\(n = 50\)), with a \(95\)% CI from \(15.76\ms\) to \(28.29\ms\) further for a \(30\ms\) walkway.
For Thai patients with chronic obstructive pulmonary disease, is there a mean increase in 6MWT distance using a \(30\ms\) walkway compared to a \(20\ms\) walkway?
In Sect. Section 29.1, the differences were defined as the \(30\ms\) distance minus the \(20\ms\) distance, which is consistent with the wording in this RQ. This RQ asks if the mean walking distance is, in general, a smaller value when subjects use a \(20\ms\) walkway compared to a \(30\ms\) walkway (that is how positive differences eventuate). The parameter is the population mean difference in 6MWT, \(\mu_d\text{.}\) Note that the RQ is worded as one-tailed.
Since the RQ asks specifically if the mean distance is smaller for a \(20\ms\) walkway, the alternative hypothesis is one-tailed (Sect. Section 28.2). According to how the differences have been defined, the alternative hypothesis is:
This hypothesis says that the mean change in the population is greater than zero, because of the wording of the RQ, and because of how the differences were defined. If the differences were defined in the opposite way (as ’the \(20\ms\) distance minus the \(30\ms\) distance’) then the alternative hypothesis would be \(\mu_d < 0\text{,}\) which has the same meaning.
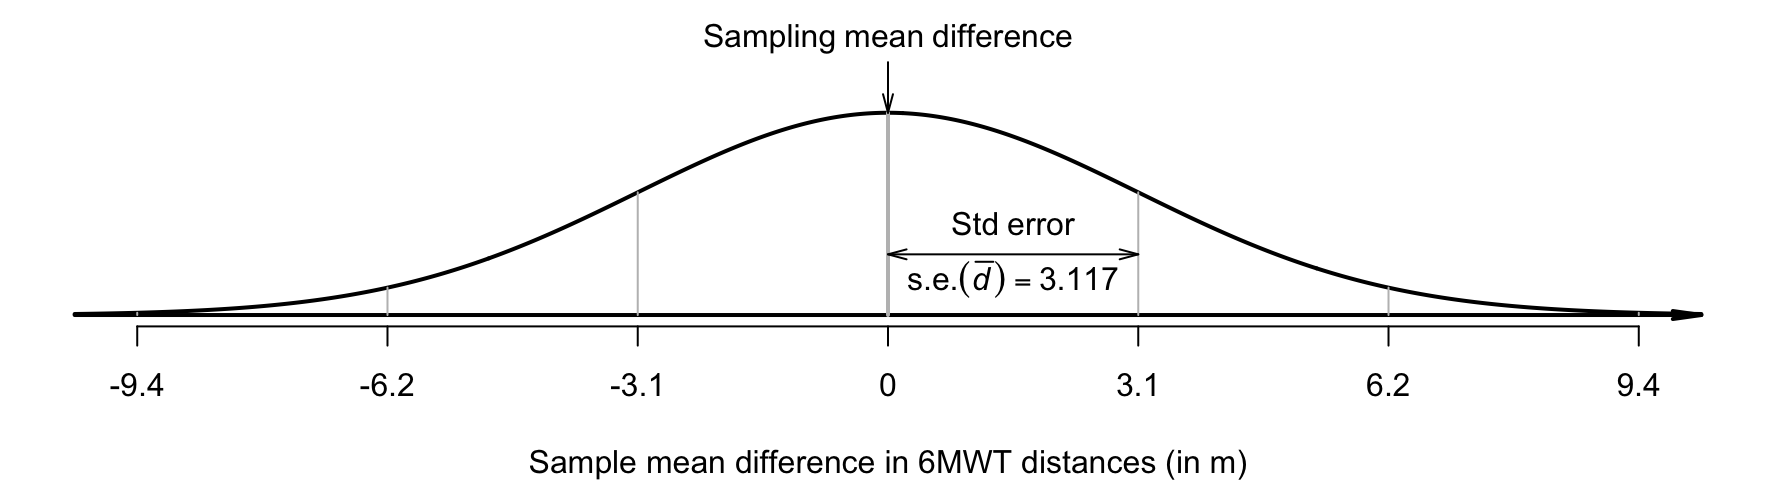
The sampling distribution, as described in Sect. Definition 29.6, still applies, where \(\mu_d\) is assumed to be the value given in \(H_0\) (see Fig. Figure 29.8):
Figure29.8.The sampling distribution is a normal distribution; it describes how the sample mean difference between the 6MWT distances varies in samples of size \(n = 50\text{.}\)
A \(P\)-value determines if the sample data are consistent with the assumption (Table Table 28.15). Since \(t = 7.07\text{,}\) and since \(t\)-scores are like \(z\)-scores, the one-tailed \(P\)-value will be very small (based on the \(68\)–\(95\)–\(99.7\) rule). Software (Fig. Figure 29.24) reports that the two-tailed \(P\)-value is less than \(0.0001\text{.}\) Hence, the one-tailed \(P\)-value is less than \(0.0001/2 = 0.00005\text{.}\)
The software clarifies how the differences have been computed. At the left of the output (Fig. Figure 29.24), the order implies the differences are found as Dist30 (the \(30\ms\) walk distance) minus Dist20 (the \(20\ms\) walk distance), the same as our definition.
The one-tailed \(P\)-value is less than \(0.00005\text{,}\) suggesting very strong evidence (Table Table 28.15) to support \(H_1\text{.}\) A conclusion requires an answer to the RQ, a summary of the evidence leading to that conclusion, and some summary statistics:
Very strong evidence exists in the sample (paired \(t = 7.07\text{;}\) one-tailed \(P < 0.0005\)) of a mean reduction in 6MWT for a \(20\ms\) walkway compared to a \(30\ms\) walkway (mean reduction: \(22.03\ms\text{;}\)\(95\)% CI: \(15.76\ms\) to \(28.29\ms\text{;}\)\(n = 50\)).
Saying ’there is evidence of a difference’ is insufficient. You must state which measurement is, on average, higher (that is, what the differences mean).
As with any CI and hypothesis test, these results apply under certain conditions. The conditions under which the results are statistically valid for paired data are similar to those for one sample mean, rephrased for differences.
This condition ensures that the distribution of the sample mean differences has an approximate normal distribution (so that, for example, the \(68\)–\(95\)–\(99.7\) rule can be used). Provided the sample size is larger than about \(25\text{,}\) this will be approximately true even if the distribution of the differences in the population does not have a normal distribution. That is, when \(n \ge 25\) the sample mean differences generally have an approximate normal distribution, even if the differences themselves don’t have a normal distribution. The units of analysis are also assumed to be independent (e.g., from a simple random sample).
If the statistical validity conditions are not met, other methods (e.g., non-parametric methods [86]; resampling methods [94]) may be used. For paired qualitative data, McNemar’s test can be used [86].
For the 6MWT data, the sample size is \(n = 50\text{,}\) so the results are statistically valid. Neither the differences in the population, nor the distances in the population for the individual walkway lengths, need to follow a normal distribution.
Skypilot is an alpine wildflower native to the Colorado Rocky Mountains (USA). In recent years, a willow shrub (Salix) has been encroaching on skypilot territory and, because willow often flowers early, [117] studied whether the willow may ’negatively affect pollination regimes of resident alpine wildflower species’ (p. \(6\,965\)).
The parameter is \(\mu_d\text{,}\) the population mean difference in day of first flowering for skypilot, less the day of first flowering for willow. A positive value for the difference means that the skypilot values are larger, and hence that willow flowered first. The RQ is:
where the alternative hypothesis is two-tailed, and \(\mu_d\) is the mean difference between first-flowering day for the native skypilot and encroaching willow.
However, the differences could be computed as willow minus skypilot first-flowering days. Either is fine, as long as you remain consistent. The meaning of any conclusions will be the same.
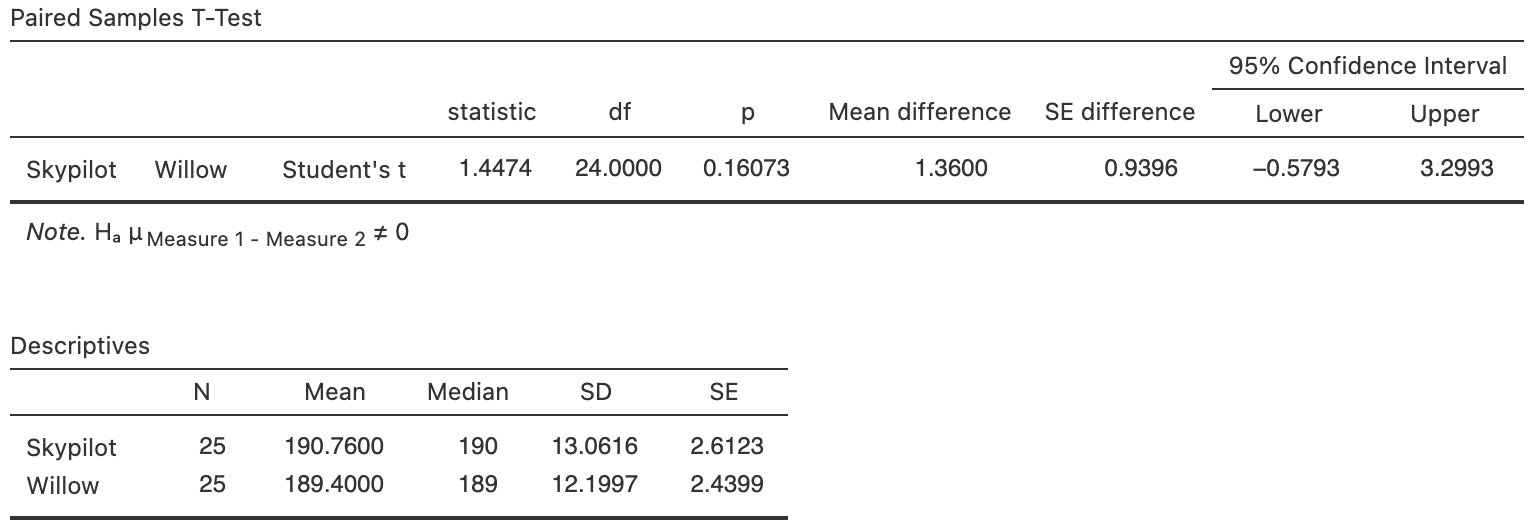
The data are summarised graphically in Fig. Figure 13.14 and numerically (Table Table 29.13, after rounding) using software output (Fig. Figure 29.25).
The standard error of the mean difference is \(\text{s.e.}(\bar{d}) = 0.9396\) (Fig. Figure 29.25 or Table Table 29.13). The sampling distribution for \(\bar{d}\) has a normal distribution, centred around \(\mu_d\) with a standard deviation of \(\text{s.e.}(\bar{d}) = 0.9396\text{.}\)
or from \(-0.52\) to \(3.24\) days. The exact \(95\)% CI (Fig. Figure 29.25) is \(-0.58\) to \(3.30\) days; the difference is because the approximate CI uses the approximate multiplier of \(2\) from the \(68\)–\(95\)–\(99.7\) rule.
as in the output. This is a relatively small value of \(t\text{,}\) so a large \(P\)-value is expected using the \(68\)–\(95\)–\(99.7\) rule. Indeed, the output shows that \(P = 0.161\text{:}\) there is no evidence of a mean difference in first-flowering day (i.e., the sample mean difference could reasonably be explained by sampling variation if \(\mu_d = 0\)).
No evidence exists (\(t = 1.45\text{;}\) two-tailed \(P = 0.161\)) that the day of first-flowering is different for the encroaching willow and the native skypilot (mean difference: \(1.36\) days earlier for willow; approximate \(95\)% CI between \(0.52\) days earlier for skypilot to \(3.24\) days earlier for willow; \(n = 25\)).
Be clear in your conclusion about how the differences are computed. Make sure to interpret the test and CI consistently with how the differences are defined.
We do not say whether the evidence supports the null hypothesis. We assume the null hypothesis is true, so we state how strong the evidence is to support the alternative hypothesis. The current sample presents no evidence to contradict the assumption (but future evidence may emerge).
[354] studied patients with Type 2 diabetes mellitus (T2DM). They randomly allocated \(32\) patients into a control group (who drank hot water), and another \(32\) patients to receive chamomile tea (p. 164):
The study was blinded so that the allocation of the intervention or control group was concealed from the researchers and statistician […] The intervention group (\(n = 32\)) consumed one cup of chamomile tea […] three times a day immediately after meals (breakfast, lunch, and dinner) for \(8\) weeks. The control group (\(n = 32\)) consumed an equivalent volume of warm water during the \(8\)-week period…
The total glucose (TG) was measured for each individual both before the intervention and after eight weeks on the intervention (a within-individuals comparison), in both the control and treatment groups (a between-individuals comparison). The data are not available, so no graphical summary of the data can be produced; however, the article gives a data summary (motivating Table Table 29.16).
Table29.16.The total glucose (TG; in \(\text{mg.dL}^{-1}\)) for two groups: those who drank chamomile tea, and those who drank hot water (the control group). The Reduction columns summarise the reduction in TG for each group.
Is there a mean reduction in TG in either group? Estimates of the mean reduction in each group can be found by constructing a CI for each group. First, the standard errors for each reduction are needed:
(A negative reduction in TG means an increase in TG.) The first CI suggests that the population mean difference is almost certainly larger than zero; the second suggests that a population mean difference of zero could reasonably have produced the sample data.
where the subscripts \(T\) and \(W\) refer to the tea and hot-water groups respectively. The \(t\)-score for the tea-drinking group is huge, so the two-tailed \(P\)-value will be very small using the \(68\)–\(95\)–\(99.7\) rule, and certainly smaller than \(0.001\text{.}\) This means that there is evidence that chamomile tea had an impact on the mean change in TG.
In contrast, the \(t\)-score for the water-drinking group is small, so the two-tailed \(P\)-value will be large using the \(68\)–\(95\)–\(99.7\) rule, and certainly larger than \(0.10\text{.}\) This means there is no evidence that placebo treatment (hot water) had any impact on mean change in TG (as one might expect for a placebo).
There is very strong evidence (\(t = 7.19\text{;}\) two-tailed \(P < 0.001\)) of a mean change in TG for the chamomile-drinking groups (mean reduction: \(38.62\,\text{mg.dL}^{-1}\text{;}\) approx. \(95\)% CI: \(27.88\) to \(49.36\,\text{mg.dL}^{-1}\text{;}\)\(n = 32\)), but no evidence (\(t = -1.10\text{;}\) two-tailed \(P > 0.10\)) of a mean change in the hot-water drinking group (mean reduction: \(-7.12\,\text{mg.dL}^{-1}\text{;}\) approx. \(95\)% CI: \(-20.08\) and \(5.84\,\text{mg.dL}^{-1}\text{;}\)\(n = 32\)).
The intervals have a \(95\)% chance of straddling the population mean reduction in TG. The sample sizes are larger than \(25\text{,}\) so the results are statistically valid.
These hypothesis tests have allowed decisions to be made about each group individually. However, the two groups ultimately need to be compared; this is considered in Sect. Section 30.8.
To compute a confidence interval (CI) for a mean difference, compute the sample mean difference, \(\bar{d}\text{,}\) and identify the sample size \(n\text{.}\) Then compute the standard error, which quantifies how much the value of \(\bar{d}\) varies across all possible samples:
where \(s_d\) is the sample standard deviation. The margin of error is (multiplier\({}\times{}\)standard error), where the multiplier is \(2\) for an approximate \(95\)% CI (using the \(68\)–\(95\)–\(99.7\) rule). Then the CI is:
Write the null hypothesis (\(H_0\)) and the alternative hypothesis (\(H_1\)); initially assume the value of \(\mu_d\) in the null hypothesis to be true.
Describe the sampling distribution, which describes what to expect from the sample mean difference based on this assumption: under certain statistical validity conditions, the sample mean difference varies with:
The \(t\)-value is like a \(z\)-score, and so an approximate \(P\)-value can be estimated using the \(68\)–\(95\)–\(99.7\) rule, or found using software. Use the \(P\)-value to make a decision, and write a conclusion.
[359] compared joint pain in stroke patients receiving a supervised exercise treatment. The same participants (\(n = 34\)) were assessed before and after treatment. The mean improvement in joint pain after \(13\) weeks was \(1.27\) (with a standard error of \(0.57\)) measured using a standardised tool.
Heart rate is measured for each individual when sitting and when standing. (Some individuals have their heart rate recorded first while sitting, and some first while standing.) Each person receives two measurements, and the difference in heart rate between sitting and standing is recorded.
If the differences were defined as the time to complete the task on the PC, minus the time to complete the same task on a tablet (one difference for each child), what do the differences mean?
Suppose, in the example of Sect. Section 29.7, the differences were defined as the day of first flowering for willow, less the day of first flowering for skypilot. Write down, and interpret the meaning of, the approximate \(95\)% CI for the mean difference in first-flowering times.
Suppose, in the example of Sect. Section 29.8, the differences were defined as increase in total glucose (TG). Write down, and interpret the meaning of the approximate \(95\)% CI for the mean increase in TG for the tea-drinking group.
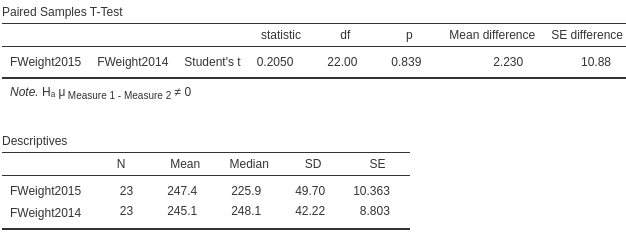
[Dataset: Fruit] [373] studied the effect of rainfall on growing Chayote squash (Sechium edule). They compared the size of the fruit in a year with normal rainfall (2015) compared to a dry year (2014) on \(24\) farms:
Ten fruits were gathered from each farm in both years, and the average (mean) weight of the fruit recorded for the farm. Since the same farms are used in both years, the data are paired (Table Table 29.17). Data is missing for Farm 20 in the dry year (2014), so there are \(n = 23\) differences.
Table29.17.The average weight of fruits (in g) in two different years, from \(24\) farms. One observation is missing for Farm 20. The change is computed as the normal year (2015) minus dry year (2014).
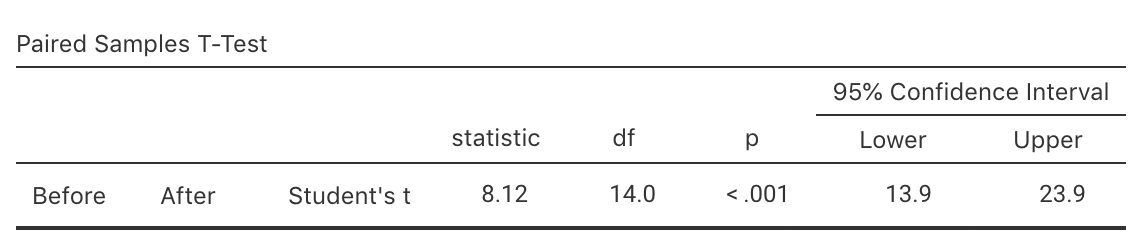
[Dataset: Captopril] In a study of hypertension [113][114], \(n = 15\) patients were given a drug (Captopril) and their systolic blood pressure measured (in mm Hg) immediately before and two hours after being given the drug.
The aim is to see if there is evidence of a reduction in blood pressure after taking Captopril. Use the data (Table Table 13.18) and the software output (Fig. Figure 29.27) to answer these questions.
Explain why it is probably more sensible to compute differences as the Before minus the After measurements. What do the differences mean when computed this way?
What is the advantage of using the same patients for both the before and after measurements, rather than one group for before measurements and a different group of people for after measurements?
People often struggle to eat the recommended intake of vegetables. [366] explored ways to increase vegetable intake in teens. Teens rated the taste of raw broccoli, and raw broccoli served with a specially-made dip.
Each teen (\(n = 100\)) had a pair of measurements: the taste rating of the broccoli with and without dip. Taste was assessed using a ’\(100\mms\) visual analogue scale’, where a higher score means a better taste. In summary:
Because the data are paired, the differences are the best way to describe the data. The mean difference in the ratings was \(5.2\text{,}\) with standard error of \(3.06\text{.}\)
[365] examined the effect of exercise on smoking. Men and women were assessed on their ’intention to smoke’, both before and after exercise for each subject (using two quantitative questionnaires). Smokers (’smoking at least five cigarettes per day’) aged \(18\) to \(40\) were enrolled for the study. For the \(23\) women in the study, the mean intention to smoke after exercise reduced by \(0.66\) (with a standard error of \(0.37\)). (Larger values for ’intention to smoke’ mean a greater intent to smoke.)
Using the data shown below, conduct a hypothesis test to determine if there is evidence that the treatment reduces the ferritin content, as intended. Make sure to include a \(95\)% CI in the conclusion.
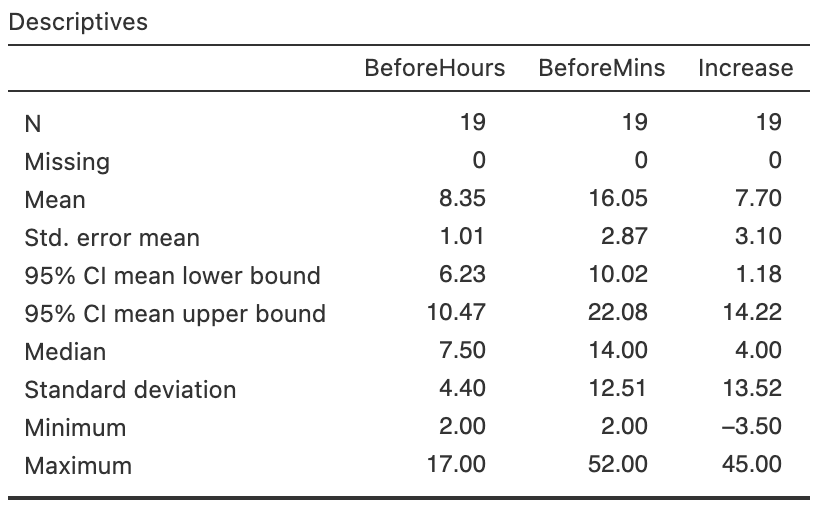
[Dataset: Stress] The concentration of beta-endorphins in the blood is a sign of stress. [116] measured the beta-endorphin concentration for \(19\) patients about to undergo surgery [113]. Each patient had their beta-endorphin concentrations measured \(12\)–\(14\hs\) before surgery, and also \(10\mins\) before surgery (in \(\text{fmol.mL}^{-1}\)).
Use the software output in Fig. Figure 29.28 to construct an approximate\(95\)% CI for the increase in beta-endorphin concentrations as surgery gets closer.
Use the software output in Fig. Figure 29.28 to write down the exact\(95\)% CI for the increase in beta-endorphin concentrations as surgery gets closer.
A study of \(n = 213\) Spanish health students [374] measured (among other variables) the number of minutes of vigorous physical activity (PA) performed by students weekly before and during the covid-19 lockdown (from March to April 2020 in Spain). Since the before and during lockdown were both measured on each participant, the data are paired. The data are summarised in Table Table 29.20.
What happens when students start university? Many students will be responsible for their own meals for the first time, so some may forgo healthy foods for convenient, but less healthy, foods. Alternatively, some may not be able to afford sufficient or healthy food. Exercise regimes may also change.
Table29.21.The student weight-change data, showing the weight of students in Week 1 at university, in Week 12, and the weight gain (all in kg). These are the first five and the last five of the \(68\) total observations. (A negative weight gain means a weight loss.)
[Dataset: Anorexia] Young girls with anorexia (\(n = 29\)) received cognitive behavioural treatment ([113]), and their weight before and after treatment were recorded. In summary:
The mean weight gain per girls was \(3.01\) pounds, with a standard deviation of \(7.31\) pounds. Find an approximate \(95\)% CI for the population mean weight gain. Do you think the treatment had any meaningful impact on the mean weight gain of the girls, based solely on these data?
[Dataset: SoilCN] [155] compared the percentage nitrogen (%N) in soils from intensively-grazed irrigated and non-irrigated pastures. The researchers paired similar irrigated and non-irrigated sites (p. 338):
The irrigated and non-irrigated pairs within each site were within \(100\ms\) of each other and were on the same soil, landform and usually the same farm with the same farm management…
[Dataset: Jumping] [115] recorded double-legged jumping distance for \(80\) healthy people, when they wore both shoes and were barefoot (Exercise Exercise 13.8.7). Use the data to form a \(95\)% CI to estimate the mean distance people can jump further when barefoot.
[Dataset: WCTennis] [108] recorded the push time (the time between a shot and resetting) for French wheelchair tennis players, while holding a racquet and not holding a racquet (Table Table 13.21; [109]). Use the data to form a \(95\)% CI to estimate the mean difference between push times with and without a racquet.