So far, you have learnt to ask an RQ, design a study, describe and summarise the data, and model sampling variation. In this chapter, you will learn to construct confidence intervals for one proportion. You will learn to:
A diagram showing the six steps of research, arranged in a cycle: Ask, Design, Collect, Classify and summarise, Analyse, Report. Step 5 (Analyse) is highlighted, captioned “CIs: One proportion”.
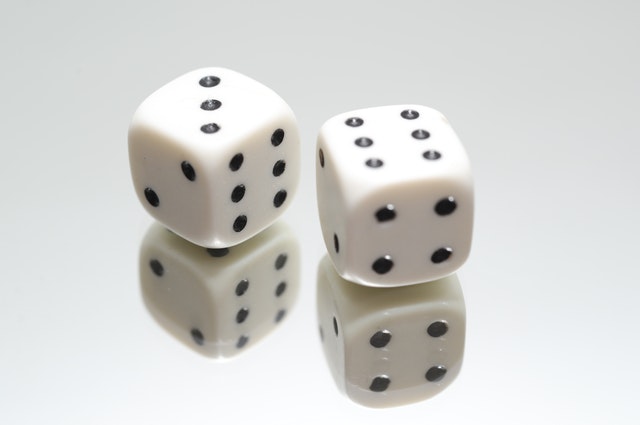
Suppose a fair, six-sided die is rolled \(25\) times. What proportion of the rolls will produce an even number? That is, what will be the value of the sample proportion of numbers that are even? Of course, no-one knows, because the proportion of rolls that will be even will not be the same for every sample of \(25\) rolls. The value of the sample proportion (the statistic) varies from sample to sample: sampling variation exists.
Section22.2Sampling distribution for \(\hat{p}\text{:}\) for \(p\) known
As seen in Chap. Chapter 19, sample statistics often vary with a normal distribution (whose standard deviation is called the standard error). However, being more specific about the details of the normal distribution (such as the values of its mean and standard deviation) is useful.
Since many values for the sample proportion are possible, the values of the sample proportion vary (called sampling variation) and have a distribution (called a sampling distribution).
To better understand the sampling distribution for the proportion of even numbers in \(25\) rolls of a die, statistical theory could be used, or thousands of repetitions of a sample of \(25\) rolls could be performed, or a computer could simulate many samples of \(25\) rolls (like we did for a roulette wheel in Sect. Section 19.2).
Here, the population proportion of even rolls is \(p = 0.5\) (using the classical approach to probability: three of the six faces of the die are even). Each sample of \(n = 25\) rolls produces a sample proportion, denoted by \(\hat{p}\text{,}\) which varies from sample to sample.
The sample proportions would be expected to vary around \(p = 0.5\) (the population proportion): some values of \(\hat{p}\) larger than \(p\text{,}\) and some smaller than \(p\text{.}\) The value of the sample proportion in \(25\) rolls could be very small or very high by chance, but we wouldn’t expect to see that very often. The sample proportions exhibit sampling variation, and the amount of sampling variation is quantified using a standard error.
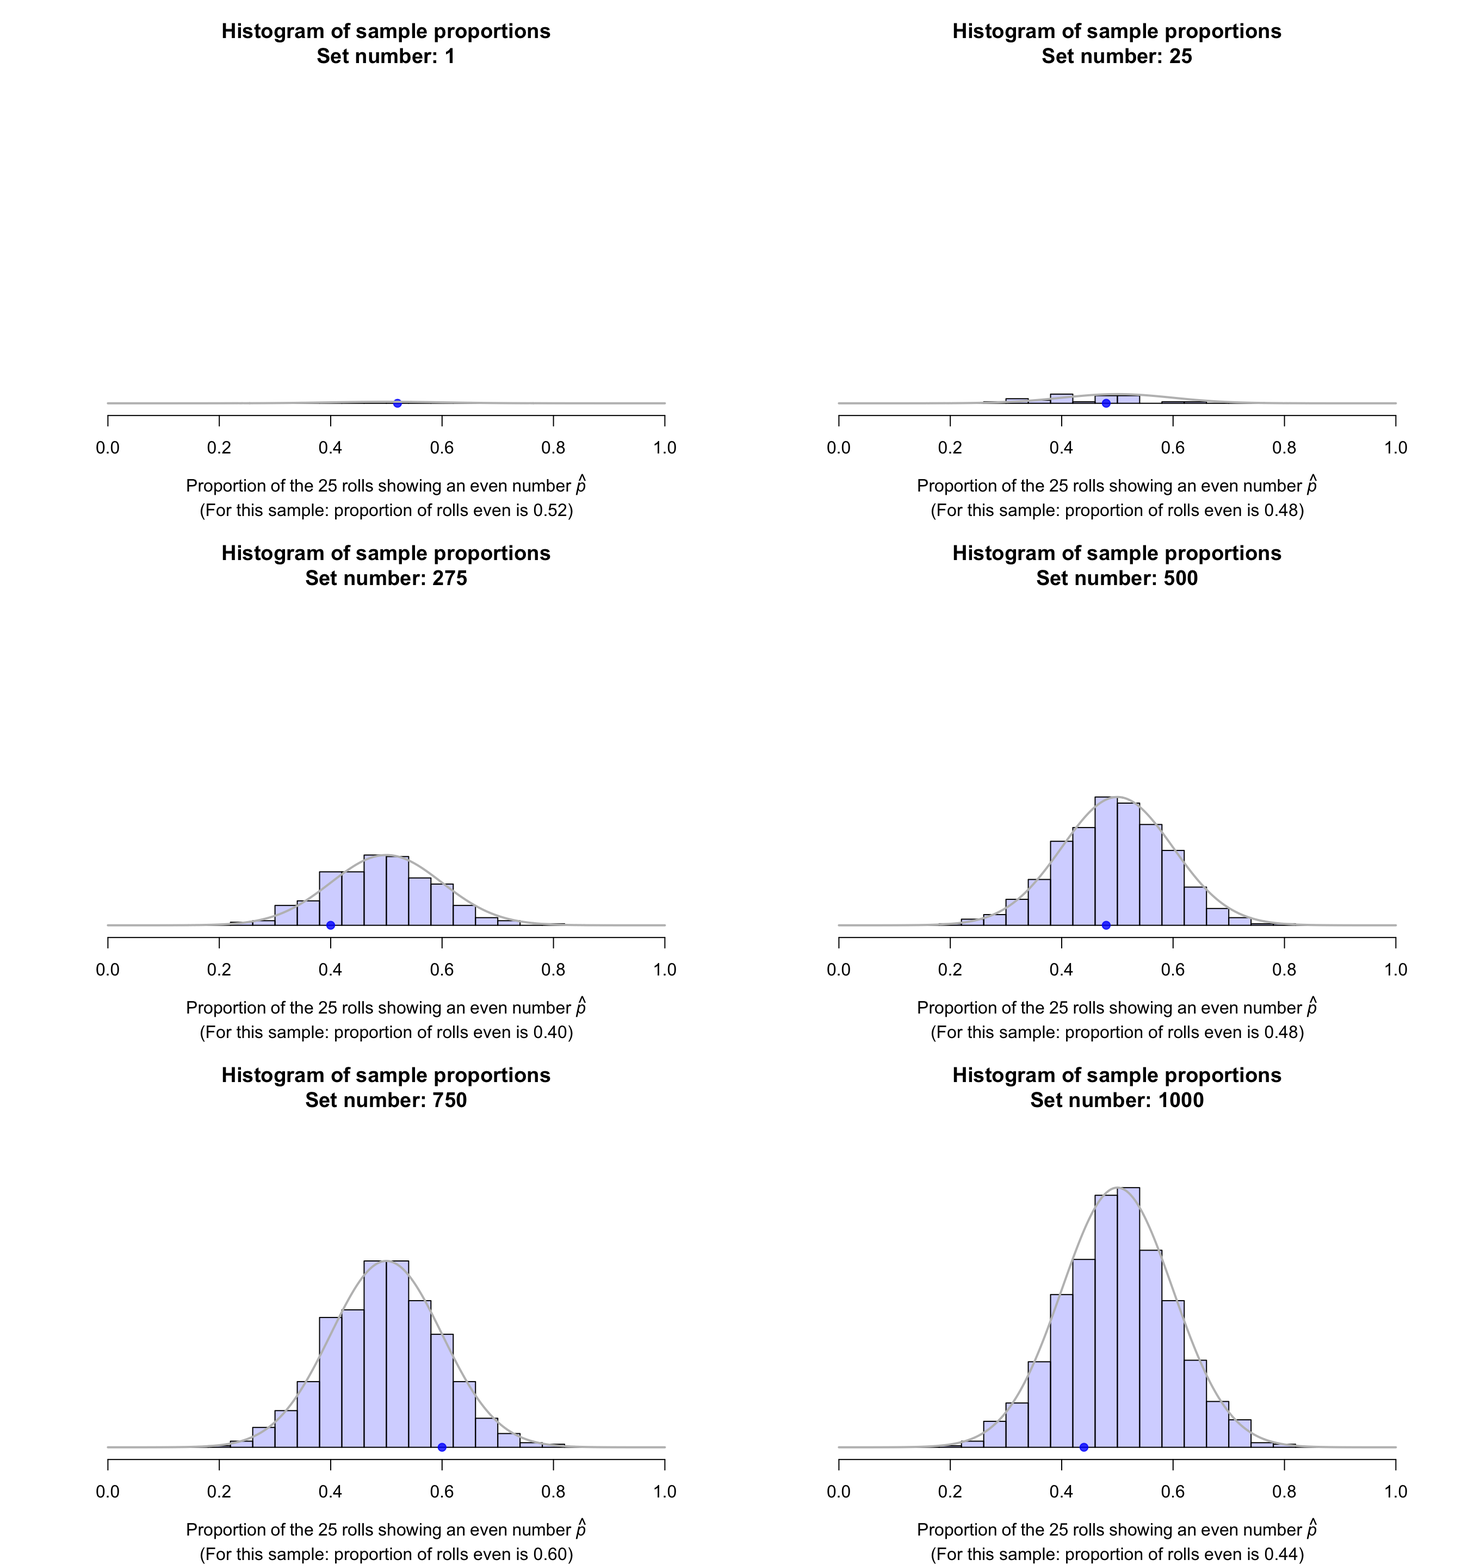
Suppose a fair die was rolled \(25\) times, and this random procedure was repeated thousands of times, and the proportion of even rolls was recorded for every one of those thousands of sets of \(25\) rolls. These thousands of sample proportions \(\hat{p}\) (one from every sample of \(n = 25\) rolls) could be shown using a histogram; see the animation below.
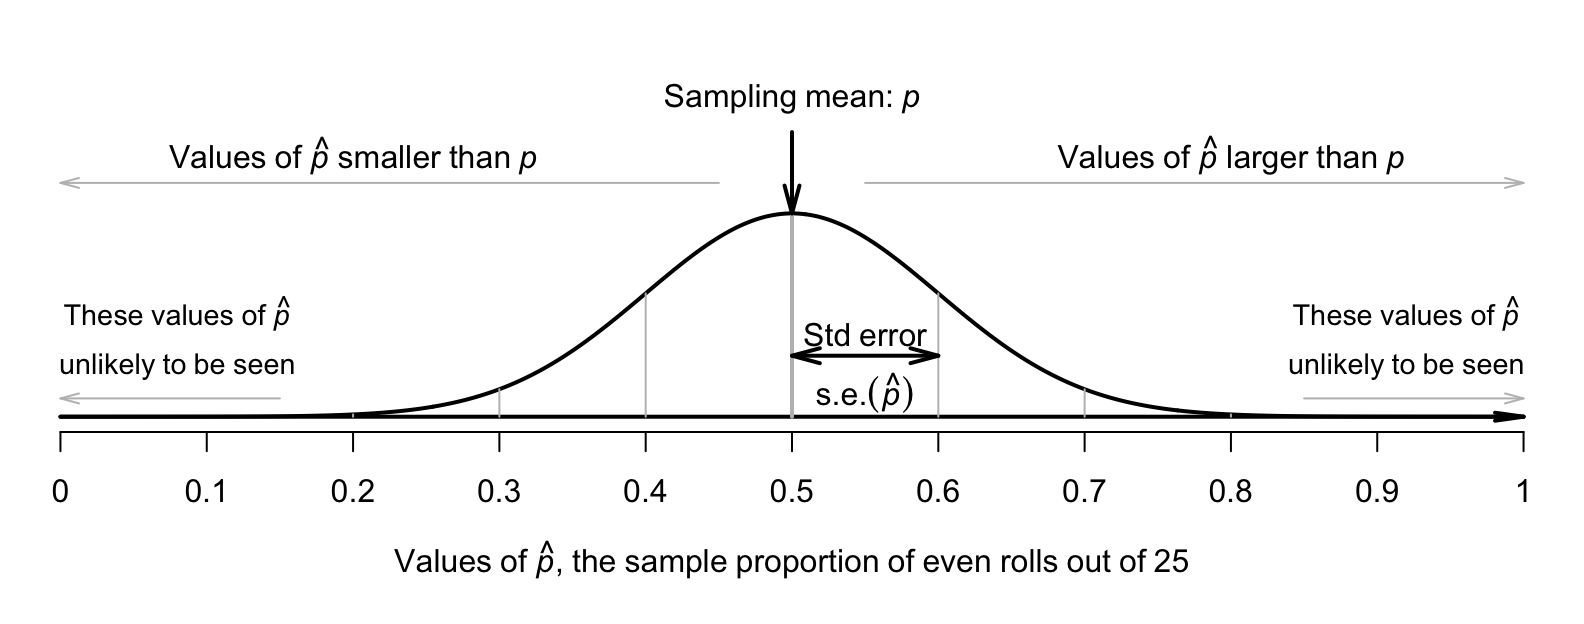
The shape of the histogram is roughly a normal distribution. The sampling distribution for \(\hat{p}\) will always have an approximately normal distribution when certain conditions are met: see Sect. Section 22.7. The mean of this distribution is called the sampling mean, and the standard deviation for this sampling distribution is called the standard error, denoted \(\text{s.e.}(\hat{p})\) (see Fig. Figure 22.3).
the standard deviation, called the standard error\(\text{s.e.}(\hat{p})\text{,}\) has the value \(0.1\text{.}\) (The source of this number will be revealed soon, in Equation (22.2).)
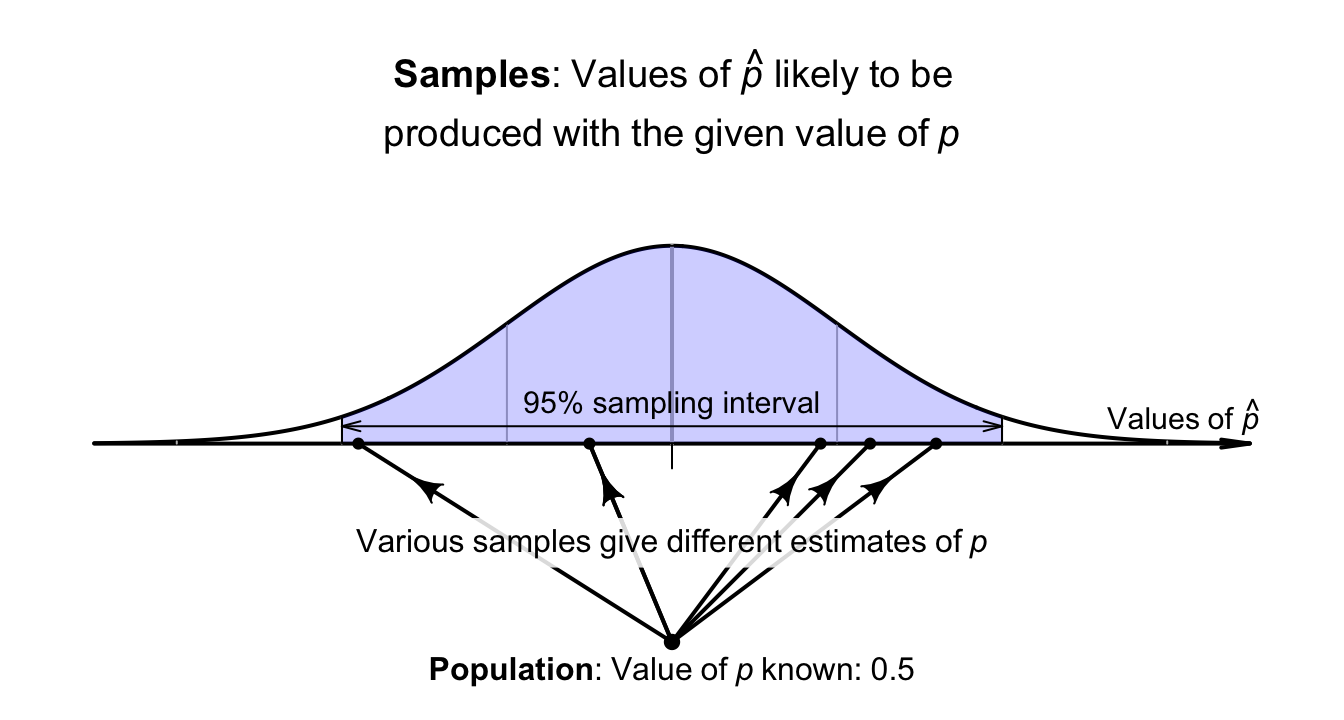
This distribution is the sampling distribution, whose standard deviation is called a standard error. A picture of this normal distribution can be drawn (Fig. Figure 22.3). While we still don’t know exactly what the next roll will produce, we have some idea of how the sample proportion varies in samples of \(25\) rolls. For instance, values of \(\hat{p}\) less than \(0.2\text{,}\) or greater than \(0.8\) are unlikely to be observed from a fair die (with \(p = 0.5\)) in \(25\) rolls.
Figure22.3.The sampling distribution is an approximate normal distribution with mean \(0.5\) and standard error \(0.1\text{;}\) it is a model for how the proportion of even rolls varies when a die is rolled \(25\) times.
Definition22.4.Sampling distribution of a sample proportion with population proportion known.
When the value of \(p\) is known, the sampling distribution of the sample proportion is (when certain conditions are met; Sect. Section 22.7) described by
The parameter \(p\) and the statistic \(\hat{p}\) are both proportions. However, the average value of the sample proportions from all possible samples can be described by a sampling mean, whose value is \(p\text{.}\) The sampling mean of the sampling distribution is the ’average’ value of all possible sample proportions, \(\hat{p}\text{.}\)
Since the possible values of the sample proportions \(\hat{p}\) can be described by an approximate normal distribution, the \(68\)–\(95\)–\(99.7\) rule (Def. Definition 20.5) applies.
For example, in Fig. Figure 22.3 (where the sampling mean is \(0.5\) and the standard error is \(0.1\)), about \(68\)% of the time a sample of \(25\) rolls will have a value of \(\hat{p}\) between \(0.5\) give-or-take one standard deviation (that is, give-or-take \(0.1\)).
So, about \(68\)% of the time, the proportion of even rolls in a sample of \(25\) rolls will lie between \(0.5 - 0.1 = 0.4\) and \(0.5 + 0.1 = 0.6\text{.}\) Similarly, about \(95\)% of the time, the proportion of even rolls will be between \(0.5\) give-or-take \((2 \times 0.1)\text{,}\) or between \(0.3\) and \(0.7\text{.}\)
These intervals tell us what values of \(\hat{p}\) are likely to be observed in samples of size \(25\text{.}\) Most of the time (i.e., approximately \(95\)% of the time), the value of \(\hat{p}\) is expected to be between \(0.30\) and \(0.70\) (Fig. Figure 22.7).
where \(\text{s.e.}(\hat{p})\) is the standard error of the sample proportion (calculated using Equation (22.1)). The multiplier is a \(z\)-score, whose value depends on how confident we wish to be that the interval contains the value of \(\hat{p}\text{.}\) For a \(95\)% interval, the multiplier is approximately\(2\text{,}\) based on the \(68\)–\(95\)–\(99.7\) rule: approximately \(95\)% of observations are within two standard deviations of the value of \(p\) (the mean of the normal distribution in Fig. Figure 22.3). That is, the approximate\(95\)% sampling interval is:
An exact value for the multiplier (i.e., a \(z\)-score) can be found using Appendix Section B.3. Any level of confidence can be used (but different multipliers are then needed). This interval is called a sampling interval.
Section22.4Sampling distribution for \(\hat{p}\text{:}\) for \(p\) unknown
In the die example (Sects. Section 22.2 and Section 22.3), the value of \(p\) was known. However, usually the value of \(p\) (the parameter) is unknown; after all, the reason for taking a sample is to estimate the unknown value of \(p\text{.}\) When the value of \(p\) is unknown, the standard error is computed using the best available estimate of \(p\text{,}\) which is \(\hat{p}\text{.}\)
Definition22.8.Sampling distribution of a sample proportion with population proportion unknown.
When the value of \(p\) is unknown, the sampling distribution of the sample proportion is (when certain conditions are met; Sect. Section 22.7) described by
where \(n\) is the size of the sample used to compute \(\hat{p}\text{,}\) and \(\hat{p}\) is the sample proportion. In general, the approximation gets better as the sample size gets larger.
When computing the standard error for a proportion, take care! Make sure you use a proportion in the formula, not a percentage (i.e., \(0.5\) rather than \(50\)%). Also: don’t forget to take the square root.
Let’s pretend for the moment that the population proportion of even rolls on a die is unknown (simply to demonstrate ideas). An estimate of the population proportion of even rolls could be found by rolling a die \(n = 25\) times, and computing \(\hat{p}\) (an estimate of \(p\)). Suppose \(11\) of the \(n = 25\) rolls produce an even number, so \(\hat{p} = 11/25 = 0.44\text{.}\) The best estimate of \(p\) is therefore \(\hat{p} = 0.44\text{.}\) We might expect the (unknown) value of \(p\) to be a little smaller than this estimate \(\hat{p}\text{,}\) or a little larger.
Using Def. Definition 22.8, the sample proportions vary with an approximate normal distribution around \(p\) (whose value is unknown), with a standard deviation (the standard error) of
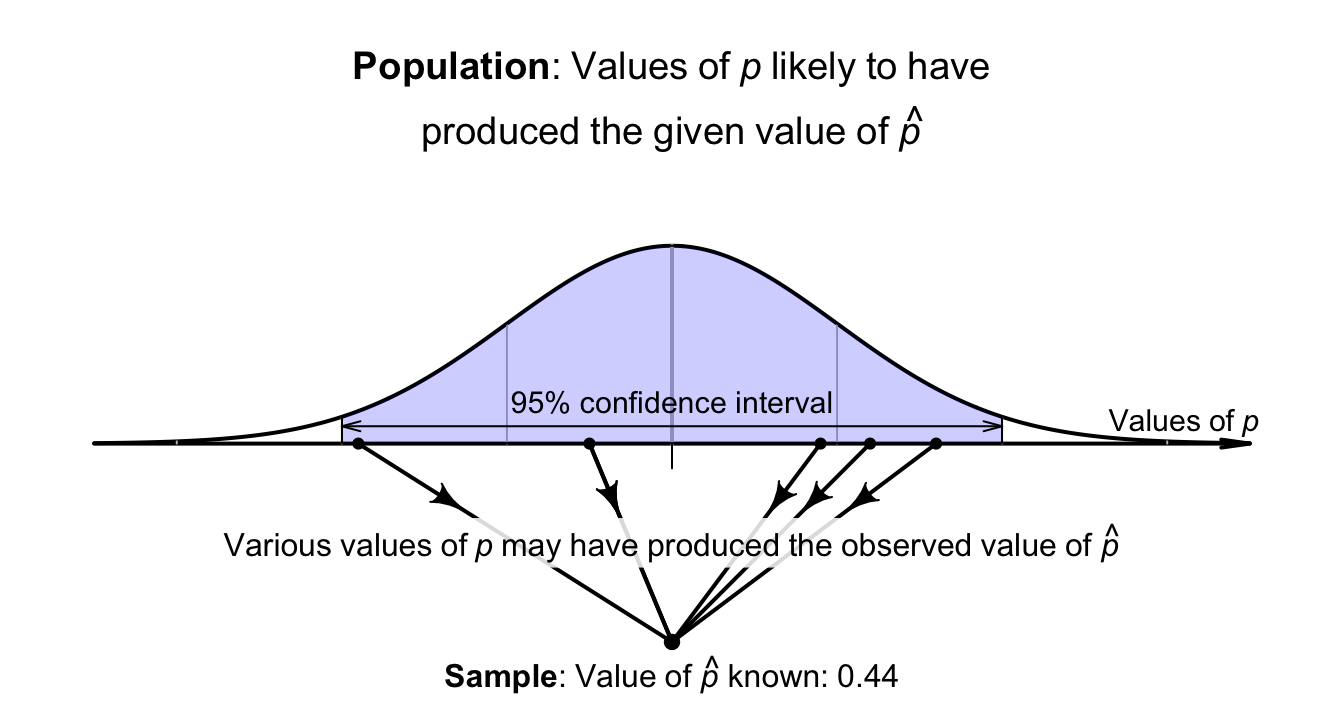
Previously, the sampling distribution was used to construct a sampling interval that was likely to contain the unknown value of \(\hat{p}\text{.}\) However, here the value of \(\hat{p}\) is known, so an interval is created that is likely to contain the unknown value of \(p\) that produced the observed value of \(\hat{p}\) (Fig. Figure 22.10).
The unknown value of \(p\) could be a little smaller or a little larger than the value of \(\hat{p}\text{;}\) the interval is the value of \(\hat{p}\text{,}\) give-or-take a little. More formally:
for a suitable multiplier. This interval for \(p\) is called a confidence interval (or a CI). The multiplier is a \(z\)-score, and the \(68\)–\(95\)–\(99.7\) rule gives approximate values for the multipliers. The give-or-take amount, called the margin of error, is \(\left(\text{multiplier}\times\text{s.e.}(\hat{p})\right)\text{.}\)
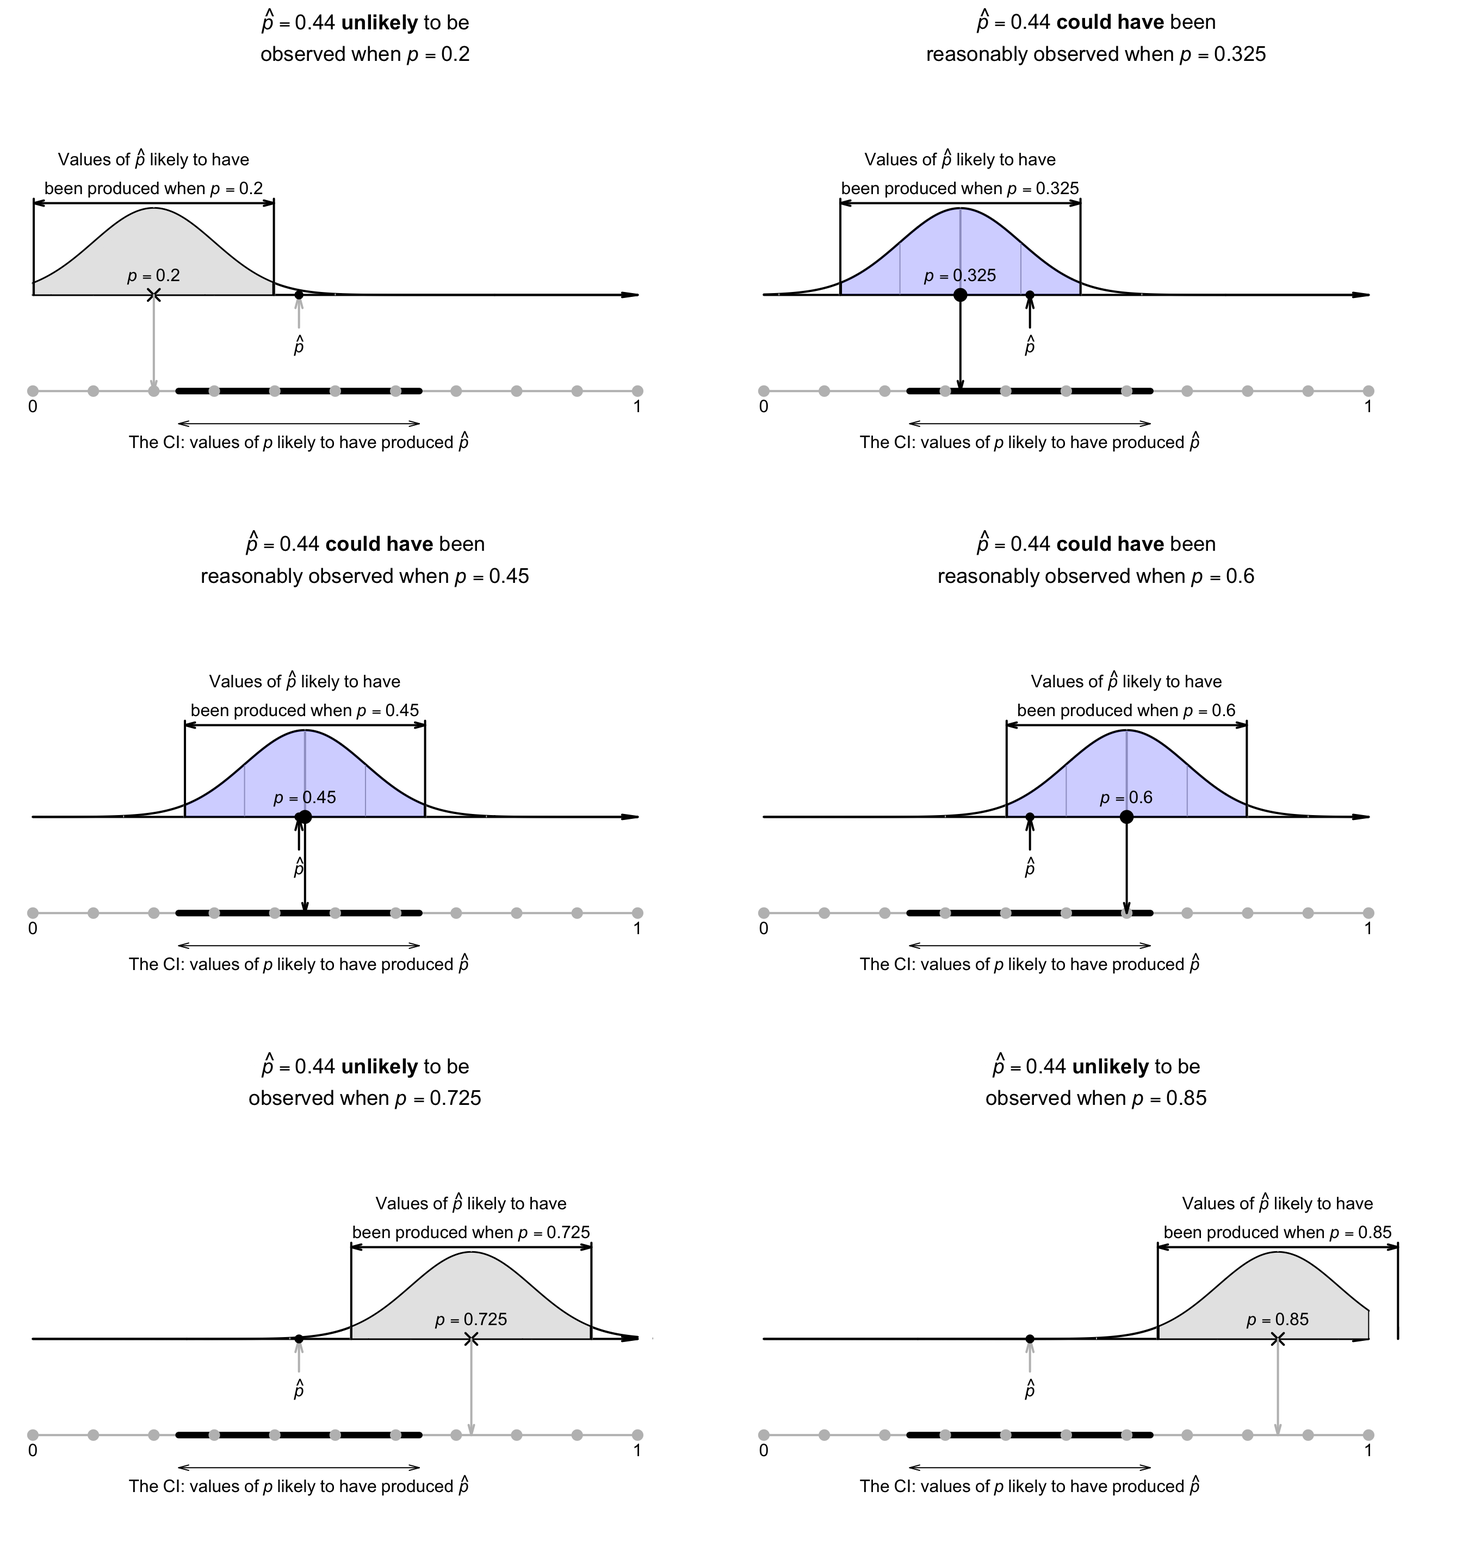
The interval, from \(0.241\) to \(0.639\text{,}\) is an interval containing values of \(p\) that could have reasonably produced the observed value of \(\hat{p} = 0.44\) (Fig. Figure 22.12). We can say the interval \(0.241\) to \(0.639\) has a \(95\)% chance of straddling the unknown value of the population proportion \(p\text{.}\)
where \(\big( \text{multiplier} \times \text{s.e.}(\hat{p})\big)\) is the margin of error, and \(\text{s.e.}(\hat{p})\) is the standard error of \(\hat{p}\) (see Equation (22.3)), where \(\hat{p}\) is the sample proportion. For an approximate\(95\)% CI, the multiplier is \(2\text{.}\)
Figure22.12.The CI gives an interval containing values of \(p\) that may have produced the observed value of \(\hat{p}\text{.}\) Here, the CI is \(0.241\) to \(0.639\text{.}\)
In general, we do not know if the computed CI contains the actual value of \(p\text{,}\) since the value of \(p\) is usually unknown. However, in this contrived example, the CI does happen to straddle the value of \(p = 0.5\text{.}\)
In this case, we know the value of the population parameter: \(p = 0.5\text{.}\) Usually we do not know the value of the parameter. After all, that’s why we take a sample: to estimate the unknown value of the population proportion.
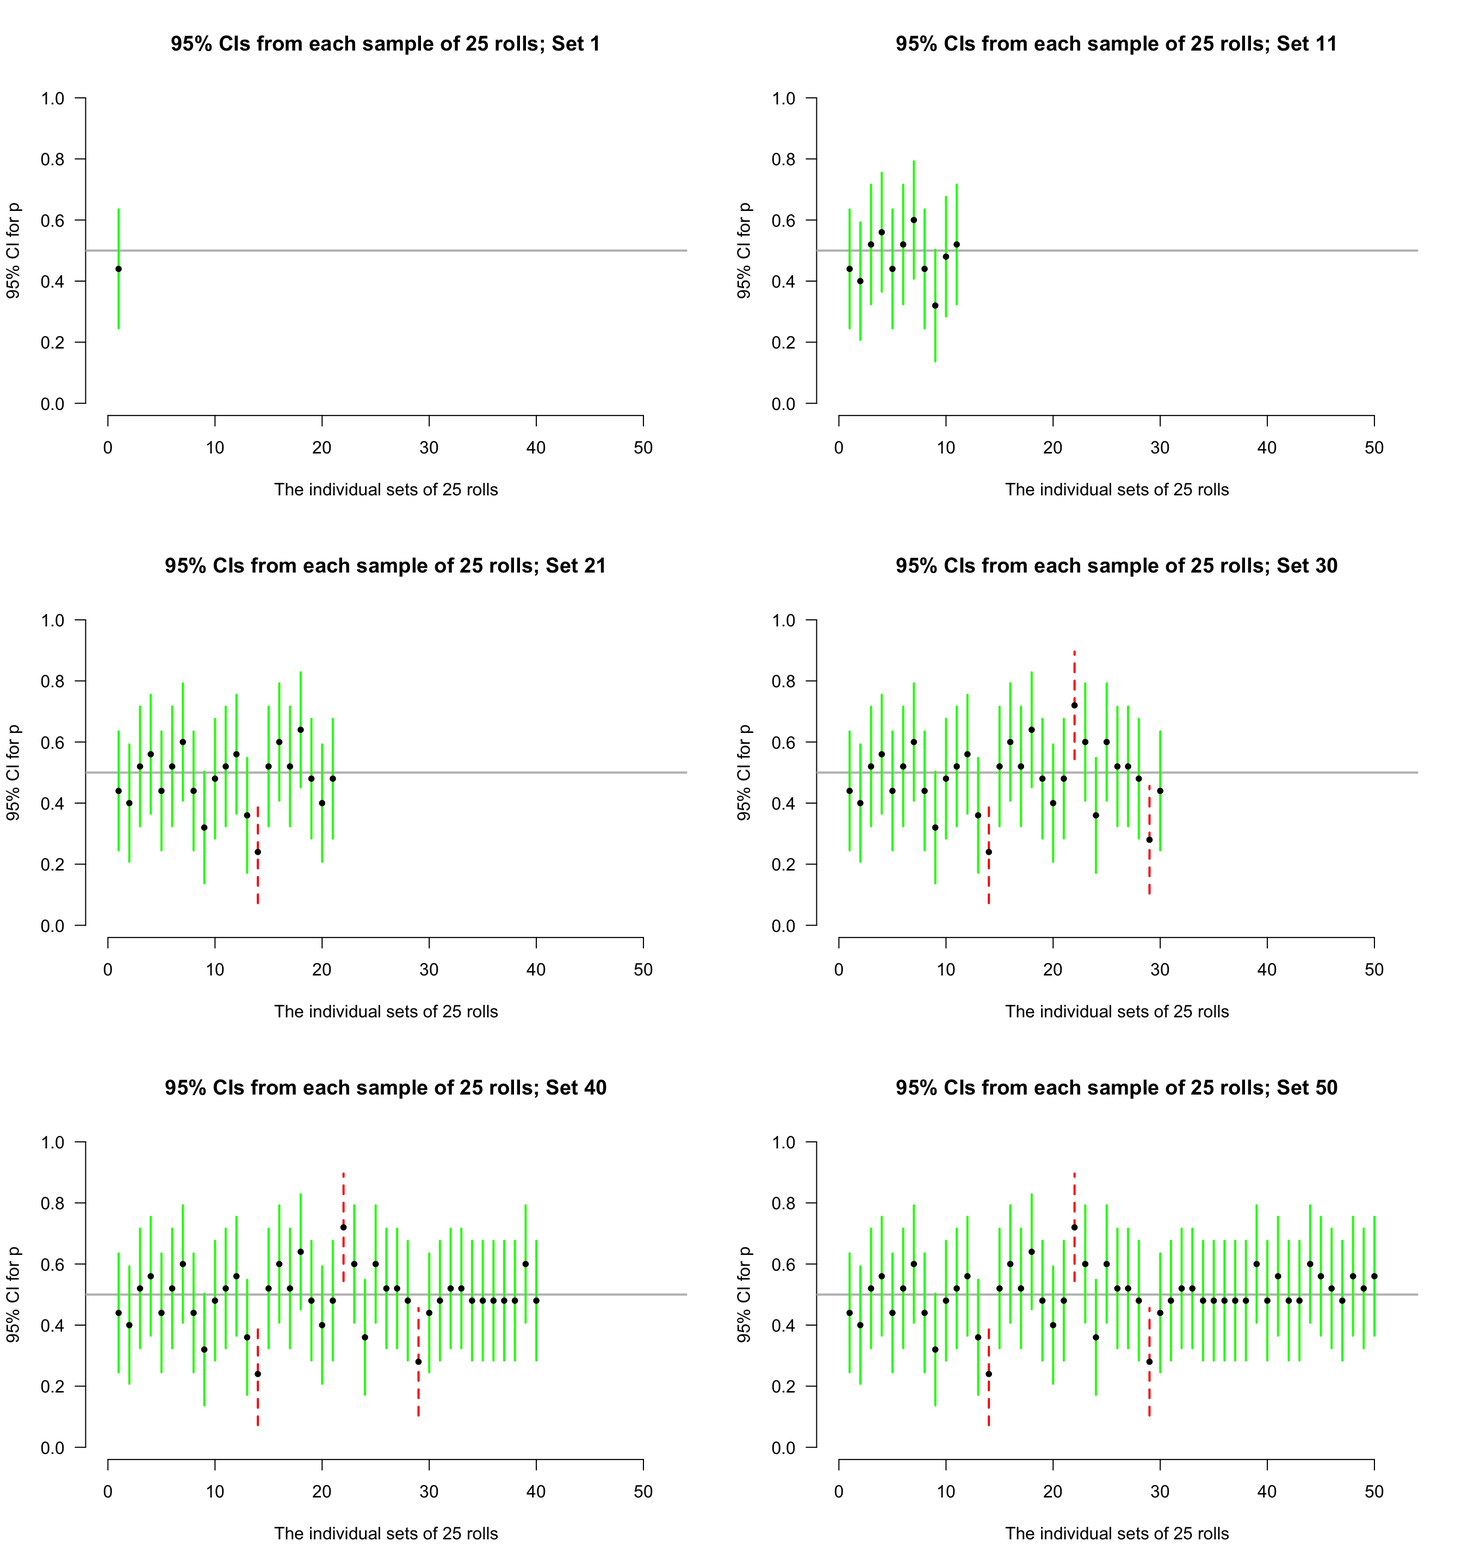
Suppose thousands of people rolled a die \(25\) times, and each person found \(\hat{p}\) for their sample, and hence computed the CI for their sample of \(25\) rolls. Every sample of \(25\) rolls could produce a different estimate \(\hat{p}\text{,}\) and so a different value for \(\text{s.e.}(\hat{p})\text{,}\) and hence a different \(95\)% CI. However, about 95% of these thousands of CIs from those thousands of samples would straddle the true proportion \(p\).
Since we usually don’t know the value of \(p\text{,}\) and since we usually only have one sample (and hence one CI), in general we never know whether the CI computed from the single sample we have straddles the value of \(p\) or not.
Again, let’s allow the computer to simulate the situation. Suppose the process of recording the sample proportion of even numbers in \(n = 25\) rolls is repeated fifty times, and for each of those fifty sets of \(25\) rolls a CI is produced (see the animation below). About \(95\)% of those \(95\)% CIs straddle the value \(p = 0.5\) (shown as solid lines), but some do not (shown as dashed lines). Of course, value of \(p\) is rarely known, so we never know if the CI computed from our single sample contains \(p\) or not.
An animation of \(50\) confidence intervals, each computed from a different sample of \(25\) die rolls; about \(95\)% of the intervals straddle the true value \(p = 0.5\text{.}\)
In general, higher confidence means wider intervals (Fig. Figure 22.15), since wider intervals are needed to be more certain that the interval contains \(\hat{p}\text{.}\) Try changing the confidence level for the CI in the interaction below.
Using the \(68\)–\(95\)–\(99.7\) rule produces approximate multipliers and hence approximate CIs. Exact multipliers (and hence exact CIs), which are \(z\)-scores, can be found using Appendix Section B.3, or software. Except for small sample sizes, the approximate CIs are generally close to the exact CIs.
If the same size samples were repeatedly taken many times, and the \(95\)% CI computed for each sample, \(95\)% of these CIs formed would contain the value of the parameter.
In Sect. Section 22.5, the CI was interpreted as giving a range of values of \(p\) that could reasonably be expected to produce the observed value of \(\hat{p}\text{.}\) The CI can also be seen as having a \(95\)% chance of straddling the unknown value of the parameter. These are close to the correct interpretation.
Commonly, the CI is interpreted as having a \(95\)% chance of containing the value of population parameter \(p\) (even though the CI either does or does not contain the value of \(p\)). This is like a convenience that captures the essence of the correct interpretation. More details on interpreting a CI are given in Sect. Section 24.4.
The CIs formed in this chapter assume the sampling distribution is approximately a normal distribution (and so, for example, the \(68\)–\(95\)–\(99.7\) rule can be applied). This is only true if certain conditions are met. If these conditions are met (so that the sampling distribution has an approximate normal distribution), the CI is called statistically valid. Whenever a CI is formed, the relevant statistical validity conditions need to be checked.
A result is statistically valid if the conditions for the underlying mathematical calculations to be approximately correct are met, such as the sampling distribution having an approximate normal distribution.
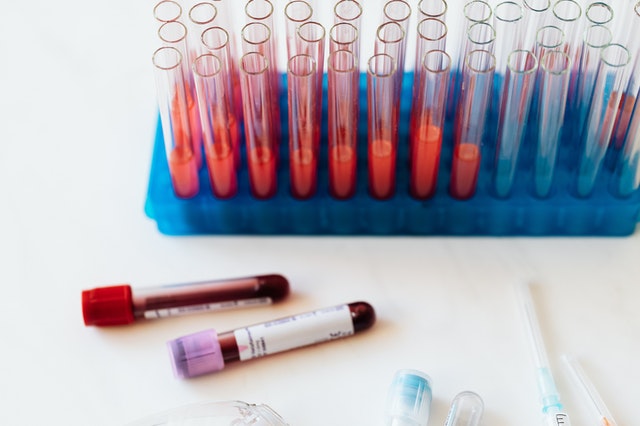
The next day, you have a big breakfast, lunch at a caf…e, and then have your blood test. Your blood is analysed, and your doctor is sent the results of the blood test.
Since you did not fast, the results may or may not be valid. The doctor can learn something, but not as much as if you had followed instructions. Similarly, if the conditions for computing the CI are not met, the calculations still produce a CI, but the results may be slightly unreliable.
The value of \(5\) here is a rough figure; some books give other values (such as \(10\)). The units of analysis are also assumed to be independent (e.g., ideally from a simple random sample).
These conditions ensure that the sampling distribution of \(\hat{p}\) has an approximate normal distribution. If these conditions are not met, the normal model may not be a good approximation to the sampling distribution (so, for example, using the \(68\)–\(95\)–\(99.7\) rule may be inappropriate) and so the CI may also be slightly unreliable.
For the die-throwing example in Sect. Section 22.5, \(11\) even rolls and \(14\) odd rolls were observed. Both exceed \(5\text{,}\) so the CI is statistically valid.
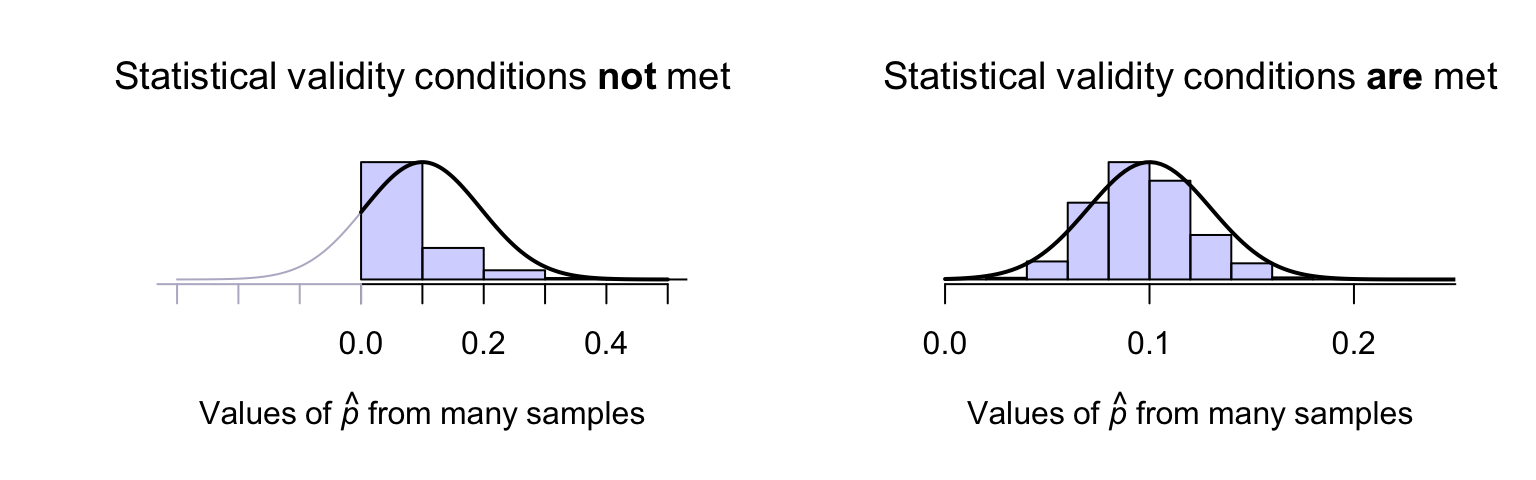
A sample of size \(n = 10\) is taken, with one positive result: \(\hat{p} = 0.1\text{.}\) The statistical validity conditions are not satisfied, and the sampling distribution is not well modelled by a normal distribution (Fig. Figure 22.21, left panel). Using a normal distribution to model the sampling distribution would be silly.
In contrast, assume a sample of size \(n = 150\) is taken, with \(15\) positive results: \(\hat{p} = 0.1\) again. However, in this case, the statistical validity conditions are satisfied, and the sampling distribution is well modelled by a normal distribution (Fig. Figure 22.21, right panel).
Figure22.21.Two proposed sampling distributions. The sampling distribution from many simulated samples is shown in the histogram; the normal model is shown by the solid lines. Left: when the statistical validity conditions are not met. Right: when the statistical validity conditions are met.
[225] studied \(360\) female college students in the United States, and found that \(61\) drank coffee daily. The parameter is \(p\text{,}\) the unknown population proportion of female college students in the United States that drink coffee daily.
The sample size is \(n = 360\text{,}\) and the sample proportion of daily coffee drinkers is \(\hat{p} = 61/360 = 0.16944\text{.}\) Of course, the sample proportion varies from sample to sample, so the sample proportion has sampling variation, measured by the standard error:
An approximate \(95\)% CI is \(0.16944 \pm (2 \times 0.01977)\text{,}\) or \(0.16944 \pm 0.03954\) (i.e., the margin of error is \(0.03954\)). Equivalently, the approximate \(95\)% CI is from \(0.130\) to \(0.209\text{,}\) after rounding appropriately. We write:
The sample proportion of female US college students who drink coffee daily is \(\hat{p} = 0.169\) (\(n = 360\)), with an approximate \(95\)% CI from \(0.130\) to \(0.209\text{.}\)
That is, values for \(p\) that may have led to this value of \(\hat{p} = 0.1694\) are between \(0.130\) and \(0.209\) with \(95\)% confidence. (This CI may or may not contain the true proportion \(p\text{.}\)) This CI is statistically valid, since \(61\) in the sample drink coffee, and \(299\) do not (and both exceed five).
To compute a confidence interval (CI) for a proportion, compute the sample proportion, \(\hat{p}\text{,}\) and identify the sample size \(n\) used to compute \(\hat{p}\text{.}\) Then compute the standard error, which quantifies how much the value of \(\hat{p}\) varies across all possible samples:
The margin of error is (multiplier\({}\times{}\)standard error), where the multiplier is \(2\) for an approximate \(95\)% CI (from the \(68\)–\(95\)–\(99.7\) rule). Then the CI is:
[346] studied how paramedics administer pain medication, and found that \(791\) of patients reporting pain did not receive pain relief, out of \(1\,766\) patients in the study who initially reported pain.
For an approximate \(95\)% CI, the multiplier (from the \(68\)–\(95\)–\(99.7\) rule) is \(2\text{.}\) Use Appendix Section B.3 to find the exact value for the multiplier.
[229] studied the eating habits of university students in Canada. They found that \(8\) students out of \(154\) met the recommendation for eating a sufficient number of servings of grains each day.
Find an approximate \(95\)% CI for the population proportion of Canadian students that meet the recommendation for eating a sufficient number of servings of grains each day.
[326] found that \(18\) of the \(n = 51\) koalas studied in a certain area over \(30\) months had crossed at least one road during that time. The parameter is \(p\text{,}\) the unknown population proportion of koalas that had crossed at least one road over the \(30\) months.
[336] studied salt intake in the United Kingdom, and found that \(2\,182\) out of the \(6\,882\) people sampled in 2007 ’generally added salt at the table’. Find an approximate \(95\)% CI for the population proportion of Britons that generally add salt at the table.
A study of turbine failures [350][352] ran \(42\) turbines for around \(3\,000\,\text{h}\text{,}\) and found that nine developed fissures (small cracks). Find a \(95\)% CI for the true proportion of turbines that would develop fissures after \(3\,000\,\text{h}\) of use. Are the statistical validity conditions satisfied?
The study also ran \(39\) turbines for around \(400\,\text{h}\text{,}\) and found that zero developed fissures. Find a \(95\)% CI for the true proportion of turbines that would develop fissures after \(400\,\text{h}\) of use. Are the statistical validity conditions satisfied?
[329] studied young Canadians aged \(12\)–\(24\text{,}\) and found \(365\) of the \(1\,516\) respondents reported sleeping difficulties after consuming energy drinks. Find a \(95\)% CI for the true proportion of young Canadians who experience sleeping difficulties after consuming energy drinks. Are the statistical validity conditions satisfied?
[348] studied the proportion of alcohol-associated calls to the ambulance service over four years in a midwestern American town. Of the \(1\,014\) calls received over the four years, \(500\) were received on the weekend (Saturday and Sunday). Find an approximate \(95\)% CI for the true proportion of alcohol-related calls that occur on the weekend.
[353] used three different AI chatbots to produce recommendations for ophthalmologist in the \(20\) largest cities in the USA. ChatGPT made \(44\) recommendations, of which \(14\) were female. Find an approximate \(95\)% CI for the true proportion of female ophthalmologists recommended in those \(20\) cities.
ChatGPT was launched in 2022. [345] studied the impact on cheating for Californian high-school students in 2023. Students were asked to respond to this question (among many others):
In the past month, how often have you used an Artificial Intelligence or digital device (e.g. ChatGPT, smart phone) as an unauthorised aid during an assessment, school assignment, or homework.
In private high schools, \(13\) of \(202\) students reported using AI in this manner at least once. Find an approximate \(95\)% CI for the true proportion of students using ChatGPT in this manner in 2023.
[Dataset: HatSunglasses] [166] recorded the number of people at the foot of the Goodwill Bridge, Brisbane, who wore hats between \(11\text{:}\)\(30\)am to \(12\text{:}\)\(30\)pm. Of the \(752\) people observed, \(101\) wore hats. Find an approximate \(95\)% CI for the true proportion of people wearing hats at this time at the foot of the Goodwill Bridge.
[Dataset: HatSunglasses] [166] recorded the number of people at the foot of the Goodwill Bridge, Brisbane, who wore sunglasses between \(11\text{:}\)\(30\)am to \(12\text{:}\)\(30\)pm. Of the \(752\) people observed, \(249\) wore sunglasses. Find an approximate \(95\)% CI for the true proportion of people wearing sunglasses at this time at the foot of the Goodwill Bridge.