So far, you have learnt to ask an RQ, design a study, describe and summarise the data, and model sampling variation. In this chapter, you will be introduced to the two big ideas in inference: confidence intervals and hypothesis testing. You will learn to:
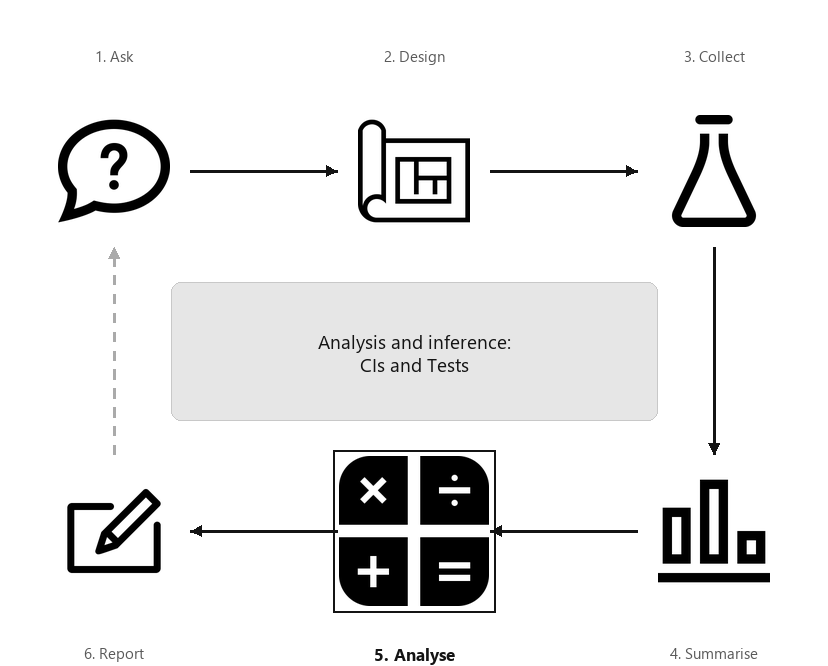
A diagram showing the six steps of research, arranged in a cycle: Ask, Design, Collect, Classify and summarise, Analyse, Report. Step 5 (Analyse) is highlighted, captioned “Analysis and inference: CIs and Tests”.
After posing an RQ (Chap. Chapter 2), a study is designed (Chaps. Chapter 3–Chapter 8) to gather the evidence to answer the RQ (Chap. Chapter 9). Then the data are classified (Chap. Chapter 10) and summarised accordingly (Chaps. Chapter 12 to Chapter 17) in preparation for answering the RQ.
This part introduces analysis: where the data are used to answer the RQ about the population. Answering the RQ (which is about a parameter) is difficult, since we only study one of the countless possible samples, and hence observe only one of the countless possible values for the statistic. The variation in the values of the statistics from sample to sample is called sampling variation (Chap. Chapter 19).
Analysis provides the tools for learning about a population parameter, based on observing one of the numerous possible values of a sample statistic. The appropriate type of analysis depends upon the number and types of variables, and the purpose of the RQ (Sect. Section 2.8):