So far, you have learnt to ask an RQ, design a study, describe and summarise the data, and understand sampling variation. In this chapter, you will learn to:
A diagram showing the six steps of research, arranged in a cycle: Ask, Design, Collect, Classify and summarise, Analyse, Report. Step 5 (Analyse) is highlighted, captioned “Models and normal distributions”.
As seen in Chap. Chapter 19, many different samples could be drawn from a population, and the value of the statistic varies from sample to sample. The challenge of research is that only one of these countless possible samples is observed. The distribution of possible values of the statistic that could be observed from all possible samples is a sampling distribution.
Since many values for the statistic are possible, the possible values of the statistic vary (called sampling variation) and have a distribution (called a sampling distribution).
As seen in Chap. Chapter 19, sampling distributions often have a normal distribution (or bell-shaped distribution). That is, the normal distribution is often used to describe the sampling distribution. We now study normal distributions, as they appear in many places in research.
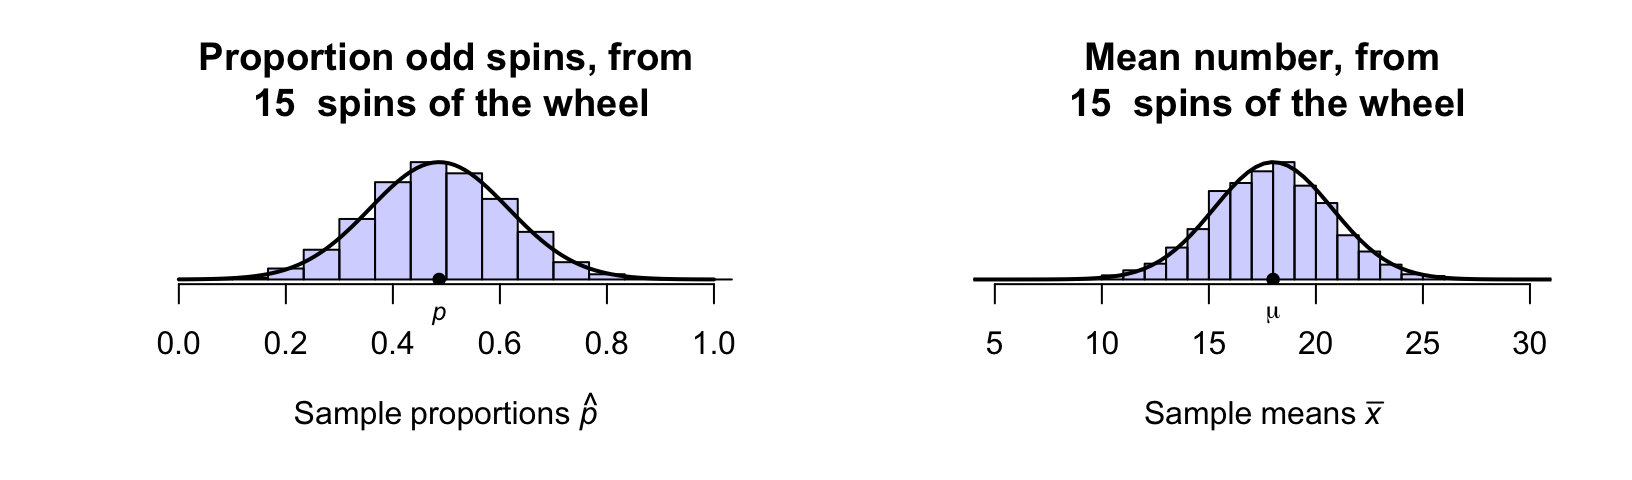
In Chap. Chapter 19, we saw that the proportion of odd spins in \(15\) spins of a roulette wheel could vary; similarly, the mean spin from \(15\) spins could vary (Fig. Figure 20.2). In both cases, these sampling distributions had a rough normal distribution shape. This is true for larger numbers of spins also (Figs. Figure 19.4 and Figure 19.7).
Figure20.2.Sampling distributions for the proportion of odd spins (left), and the mean of the numbers after \(15\) roulette wheel spins (right) are approximate normal distributions. The solid lines are theoretical normal distributions.
The histograms in Fig. Figure 20.2 are based on results from a limited number of simulations. The solid lines shown in Fig. Figure 20.2 are actual normal distributions, and represent how the histogram might appear theoretically if we used an infinite number of simulations. The normal distributions are models for what might occur in the population, so normal distributions are also called normal models. Since the models represent populations, the mean of the model is denoted \(\mu\) and the standard deviation is denoted \(\sigma\text{.}\)
A model is a theoretical or ideal concept. A model skeleton isn’t \(100\)% accurate and certainly not exactly like your skeleton; nonetheless, it suitably approximates reality. None of us probably have a skeleton exactly like the model, but the model is still useful and helpful. Likewise, a sampling distribution may not have exactly a normal shape, but the model is still useful and helpful. The model is a way of describing a theoretical distribution in the population. A model is a simple (but not overly simple) approximation to reality.
The histograms in Fig. Figure 20.2 are not exactly normal distributions, but are very close to normal distributions, and certainly close enough for most purposes. Many, but not all, sampling distributions have approximate normal distributions.
Sampling distributions represent theoretical distributions of sample statistics, not the distribution of sample data. When the sampling distribution is a normal distribution, the mean of the distribution is called the sampling mean and the standard deviation is called the standard error.
Apart from their use in modelling theoretical sampling distributions, some quantitative variables have approximate normal distributions too, when the distribution of the data in the population can be approximately modelled by a normal distribution.
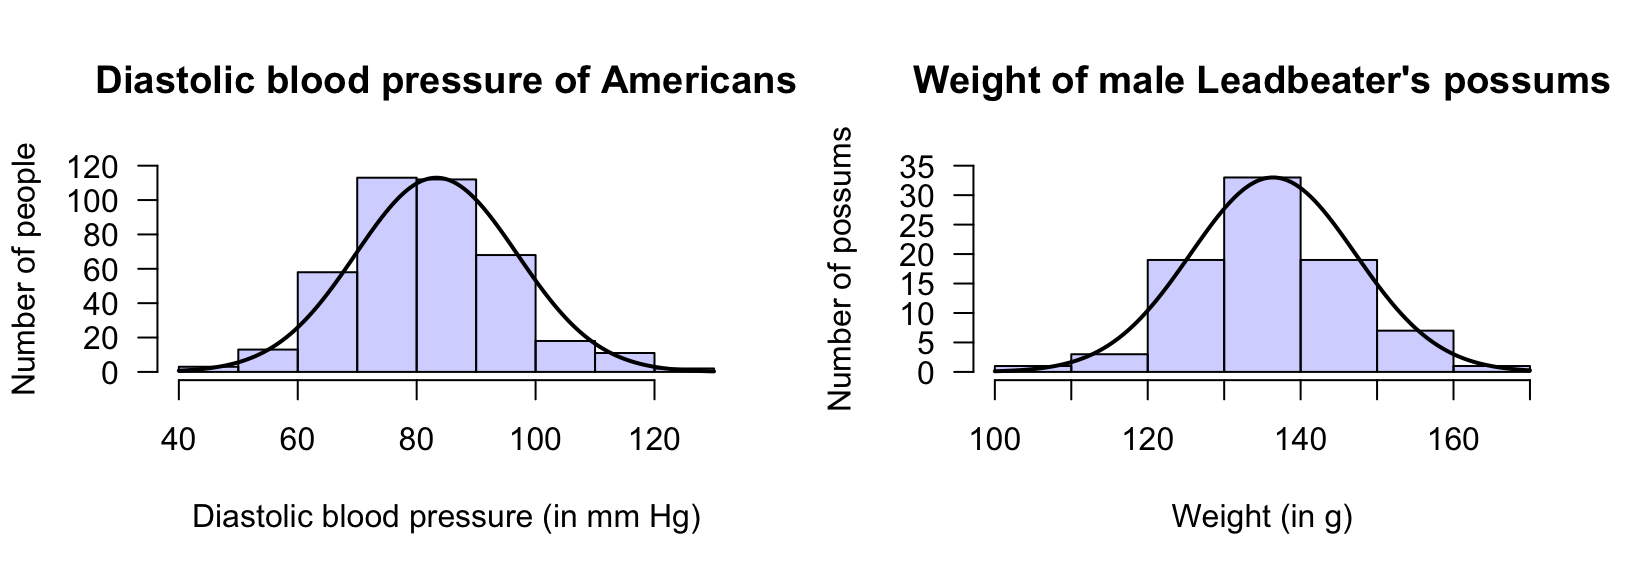
Some quantitative variables have approximate normal distributions. Figure Figure 20.4 (left panel) shows the diastolic blood pressure of \(398\) Americans [170][171]. Figure Figure 20.4 (right panel) shows the weight of \(83\) male Leadbeater’s possums [29].
Figure20.4.Two normal distributions. Left: diastolic blood pressure of a sample of \(398\) Americans. Right: the weight of a sample of \(83\) male Leadbeater’s possums. The solid lines are the approximate normal model for the variable in the population.
Section20.3Normal distributions and the 68–95–99.7 rule
Normal distributions have a shape that is symmetric about the mean, with a bell shape. Half the values are greater than the mean, and half the values are less than the mean. The total probability represented by a normal distribution is one (or \(100\)%). For example, every sample will produce a sample proportion between \(0\) and \(1\) and so is represented somewhere in Fig. Figure 20.2 (left panel); every American has a diastolic blood pressure and so is represented somewhere in Fig. Figure 20.4 (left panel); every male Leadbeater’s possum has a weight and so is represented somewhere in Fig. Figure 20.4 (right panel).
In theory, no upper limit or lower limit exists for a variable modelled using a normal distribution. In practice, this is rarely true, but usually never presents a problem. Consider the normal distributions in Fig. Figure 20.4, for example. The normal distribution shown for the diastolic blood pressure (left panel) has no lower or upper limit in theory, but all practical values of diastolic blood pressure are captured by that part of the normal distribution shown. The normal distribution implies almost no-one has a diastolic blood pressure below \(40\) Hg or above \(130\) Hg.
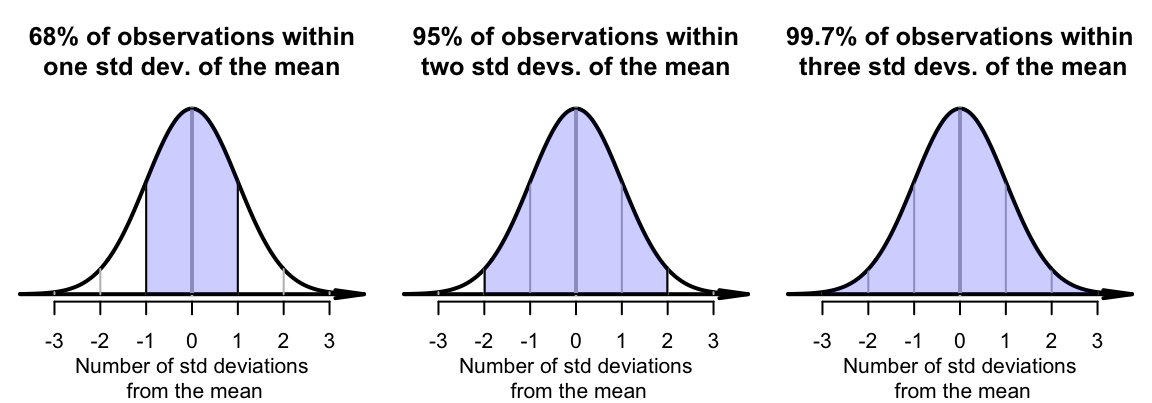
These properties are true for all normal distributions, whatever the quantity, whatever the value of the mean, and whatever the value of the standard deviation (Fig. Figure 20.6).
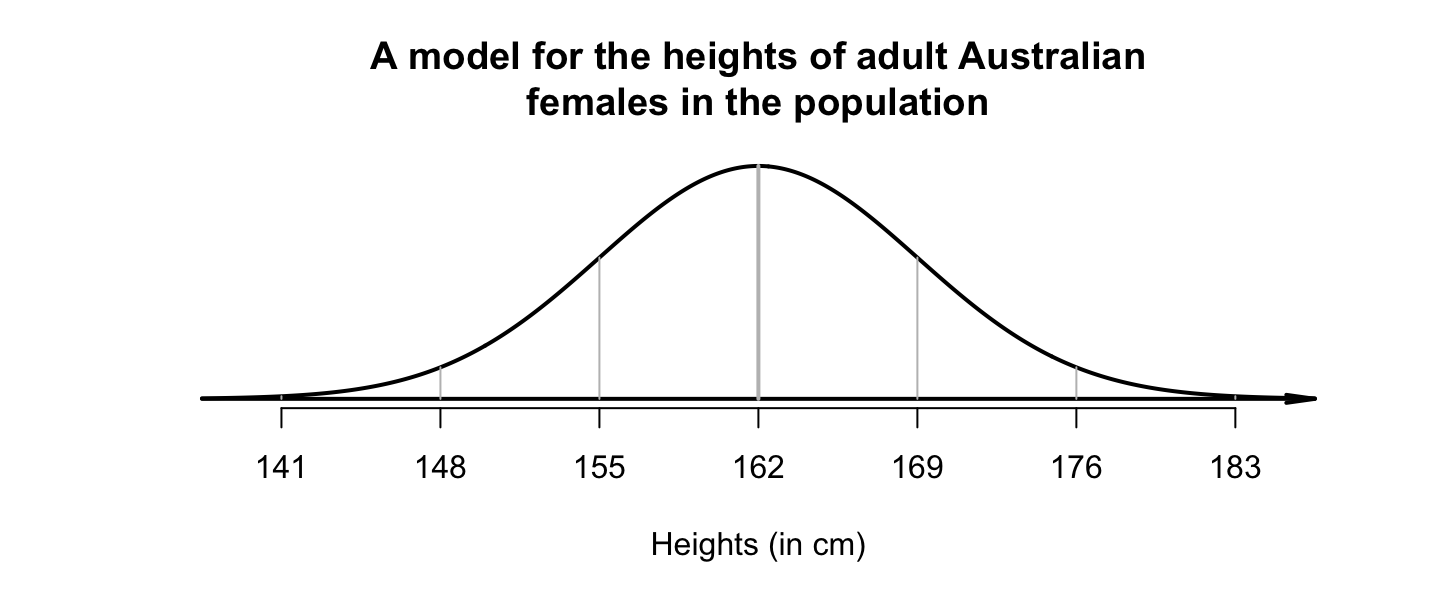
Suppose the heights of Australian adult females in the population can be modelled with a normal distribution having a mean of \(\mu = 162\) cm, and a standard deviation of \(\sigma = 7\) cm, and follow a normal distribution (Fig. Figure 20.8). Using the \(68\)–\(95\)–\(99.7\) rule, approximately \(68\)% of Australian women will be between \(162 - 7 = 155\) cm and \(162 + 7 = 169\) cm tall using this model. Similarly, approximately \(95\)% of Australian women will be between \(162 - (2 \times 7) = 148\) cm and \(162 + (2 \times 7) = 176\) cm tall.
Since the \(68\)–\(95\)–\(99.7\) rule (Def. Definition 20.5) applies for all normal distributions, the percentages in the rule only depend on how many standard deviations (\(\sigma\)) a value (\(x\)) is from the mean (\(\mu\)). This information can be used to learn more about how values are distributed in a normal distribution.
For example, suppose heights of Australian adult females can be modelled with a normal distribution having a mean of \(\mu = 162\) cm, and a standard deviation of \(\sigma = 7\) cm (Example Example 20.7). Using this model, the proportion of Australian adult women taller than \(169\) cm can be determined.
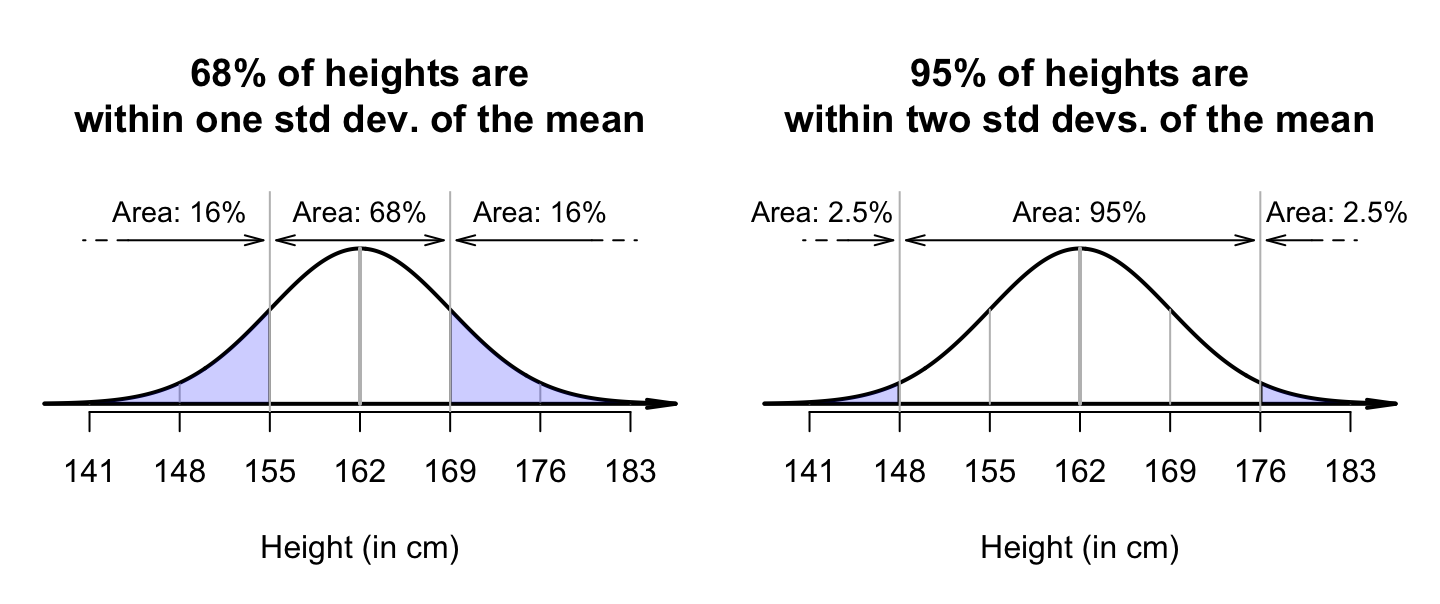
From a picture (Fig. Figure 20.10, left panel), \(162 + 7 = 169\) cm is one standard deviation above the mean. Since \(68\)% of values are within one standard deviation of the mean, \(32\)% are outside that range (some shorter; some taller). Hence, \(16\)% are taller than one standard deviation above the mean, so the answer is about \(16\)%. (Another \(16\)% are shorter than one standard deviation below the mean, or less than \(162 - 7 = 155\) cm in height.)
Again, drawing a picture is helpful (Fig. Figure 20.10, right panel). Since \(162 - (2 \times 7) = 148\text{,}\)\(148\) cm is two standard deviations below the mean. Since \(95\)% of values are within two standard deviations of the mean, \(5\)% are outside that range (half smaller, half larger; see Fig. Figure 20.10, right panel), so that \(2.5\)% are shorter than \(148\) cm. (Another \(2.5\)% are taller than \(162 + 14 = 176\) cm.)
Figure20.10.Left: what proportion of Australian adult females are taller than \(169\) cm? Right: what proportion of Australian adult females are shorter than \(148\) cm?
Again, the percentages only depend on how many standard deviations (\(\sigma\)) the value (\(x\)) is from the mean (\(\mu\)). The number of standard deviations that an observation is from the mean is called a \(z\)-score. A \(z\)-score is computed using
\begin{equation}
z = \frac{x - \mu}{\sigma},\tag{20.1}
\end{equation}
where \(\mu\) is the mean of the distribution, and \(\sigma\) is the standard deviation of the distribution (measuring the variation in the \(x\)-values).
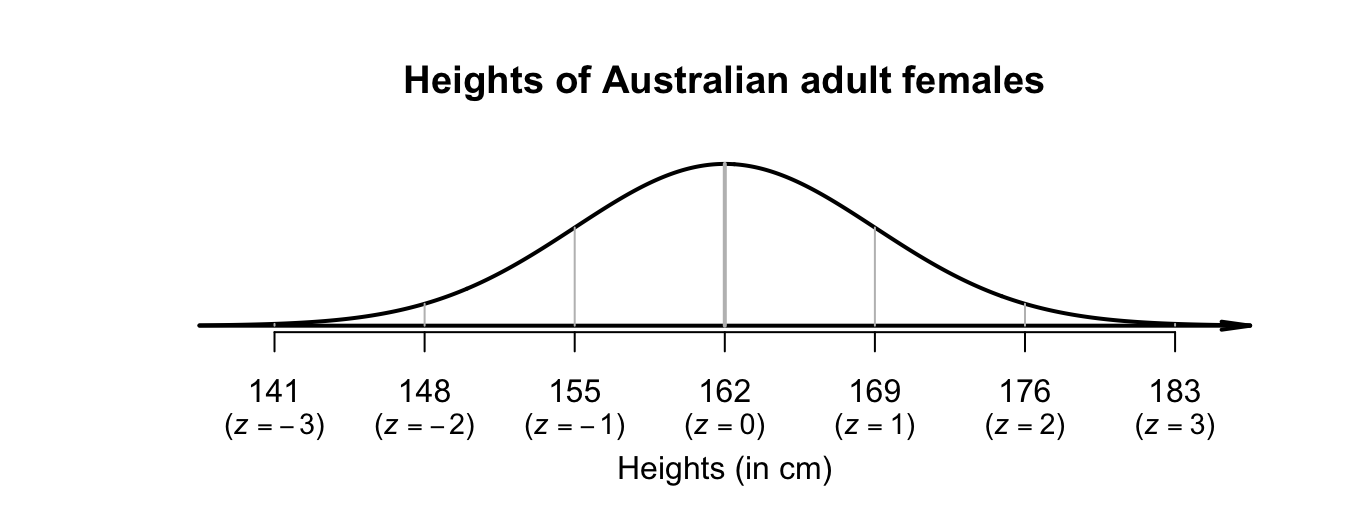
Consider the model for the heights of Australian adult females: a normal distribution, mean \(\mu = 162\) cm, standard deviation \(\sigma = 7\) cm (Fig. Figure 20.14). Using this model:
Section20.5Approximating areas (percentages) using the 68–95–99.7 rule
As seen above, the \(68\)–\(95\)–\(99.7\) rule can be used to approximate percentages under normal distributions. The rule can even be used for values that do not exactly align with \(1\text{,}\)\(2\) or \(3\) standard deviations from the mean.
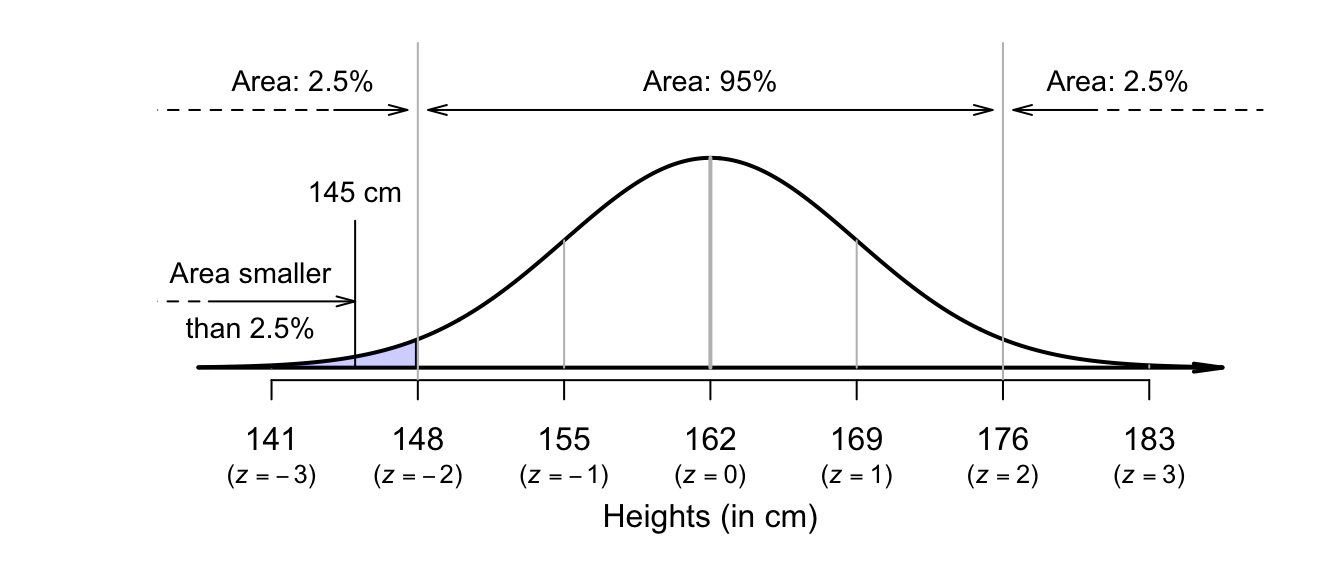
Suppose again that heights of Australian adult females can be modelled with a normal distribution with a mean of \(\mu = 162\) cm, and a standard deviation of \(\sigma = 7\) cm (Fig. Figure 20.14). To find the proportion of women shorter than \(145\) cm, first draw the situation (Fig. Figure 20.15). Proceeding as before, we ask ‘How many standard deviations from the mean is \(145\) cm?’ Using Equation (20.1), \(145\) cm corresponds to a \(z\)-score of
What percentage of observations are less than this \(z\)-score? This case is not covered by the \(68\)–\(95\)–\(99.7\) rule, though the rule can be used to make rough estimates.
About \(2.5\)% of observations are less than \(2\) standard deviations below the mean; that is, about \(2.5\)% of women are shorter than \(148\) cm. So the percentage of females shorter than \(145\) cm (that is, even shorter than \(148\) cm, and so further into the tail of the distribution) will be smaller than \(2.5\)%. While we don’t know the probability exactly, it will be smaller than \(2.5\)%.
Percentages found this way are very approximate, but often sufficient. However, more accurate percentages are found using tables compiled for this very purpose (Appendices Section B.1 and Section B.2). We now learn to use these tables.
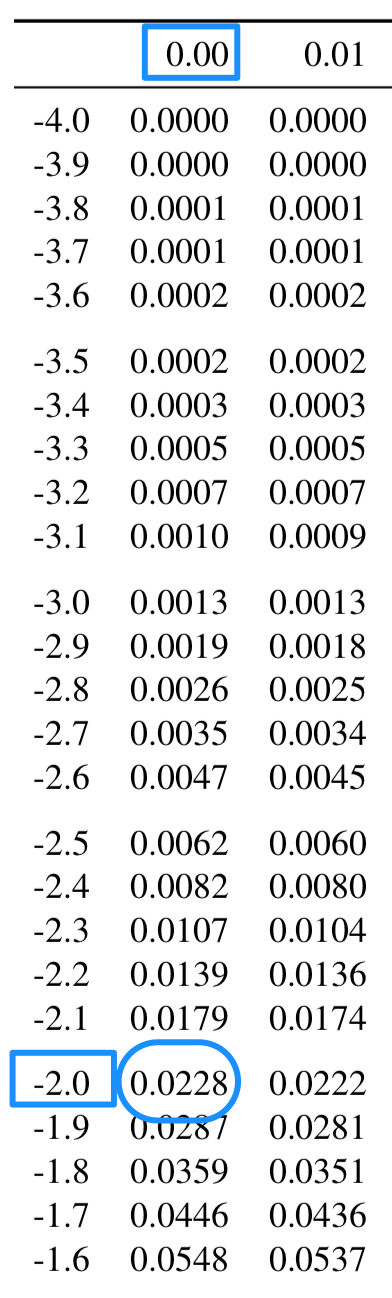
Areas under normal distributions can be found using online tables, or hard copy tables, for any \(z\)-score. The online tables are easier to use, but only the hard-copy tables are explained in this book (see the online version of this book for the online tables, and instructions for using the online tables). The tables (Appendices Section B.1 and Section B.2) work with \(z\)-scores to two decimal places, so consider the \(z\)-score from Sect. Section 20.5 as \(z = -2.43\text{.}\)
Using Appendix Section B.1, find \(-2.4\) in the left margin of the table (Fig. Figure 20.16), and find the second decimal place (in this case, \(3\)) in the top margin of the table: where these intersect is the area (or probability) less than the \(z\)-score of \(-2.43\text{;}\) that is, the probability of finding a \(z\)-score less than \(z = -2.43\) is \(0.0075\text{,}\) or about \(0.75\)%.
Either the hard-copy or online tables gives an answer of \(0.75\)%. This is consistent with the rough answer using the \(68\)–\(95\)–\(99.7\) rule: a value less than \(2.5\)%.
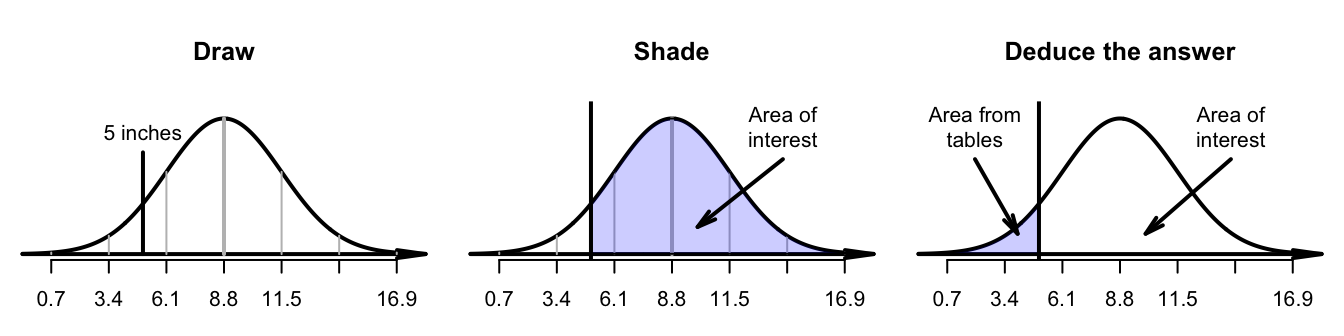
use tables: the probability of a tree diameter shorter than \(5\) inches is \(0.0793\text{.}\) (Remember: the tables always give area less than the value of \(z\text{.}\))
deduce the answer (Fig. Figure 20.19, right panel): since the total area under the normal distribution is one (or \(100\)%), the probability of a tree diameter greater than \(5\) inches is \(1 - 0.0793 = 0.9207\text{,}\) or about \(92\)%.
Our normal-distribution tables always provide area to the left of the \(z\)-score. Drawing a picture of the situation is important: it helps visualise getting the area requested from the area the tables provide. Remember: the total area under the normal distribution is one (or \(100\)%).
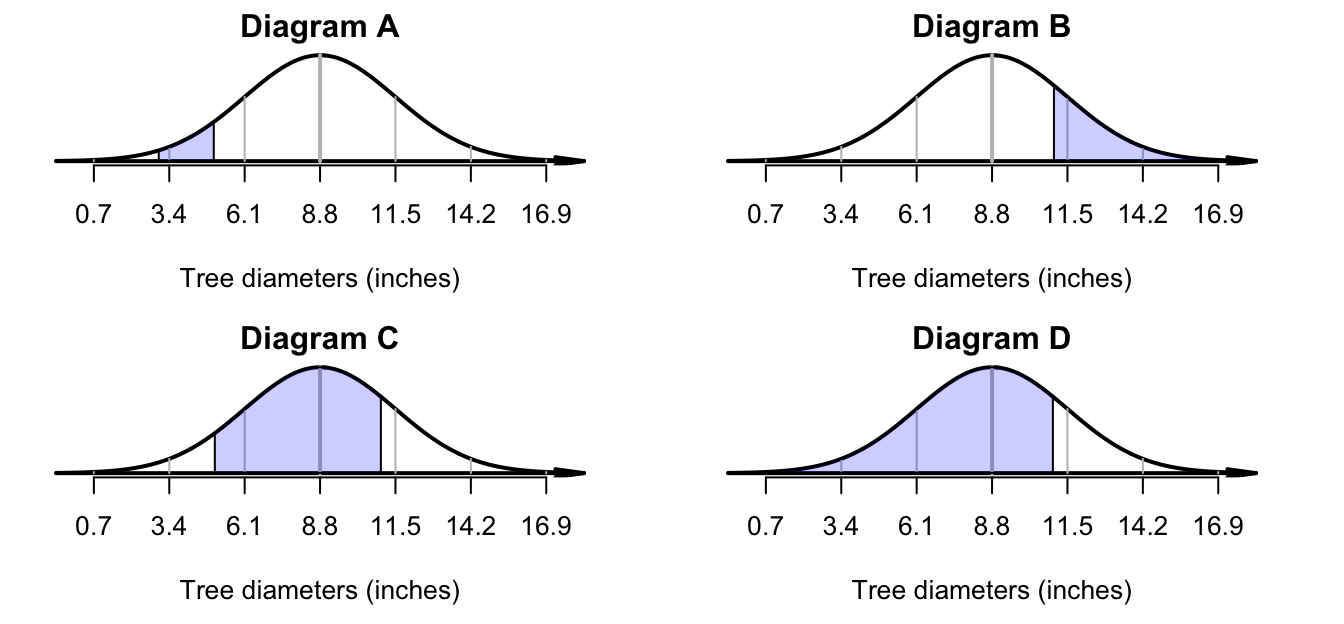
First, draw the situation, and shade ‘between \(5\) and \(11\) inches’ (Fig. Figure 20.22, Diagram C). Then, compute the \(z\)-scores for both tree diameters:
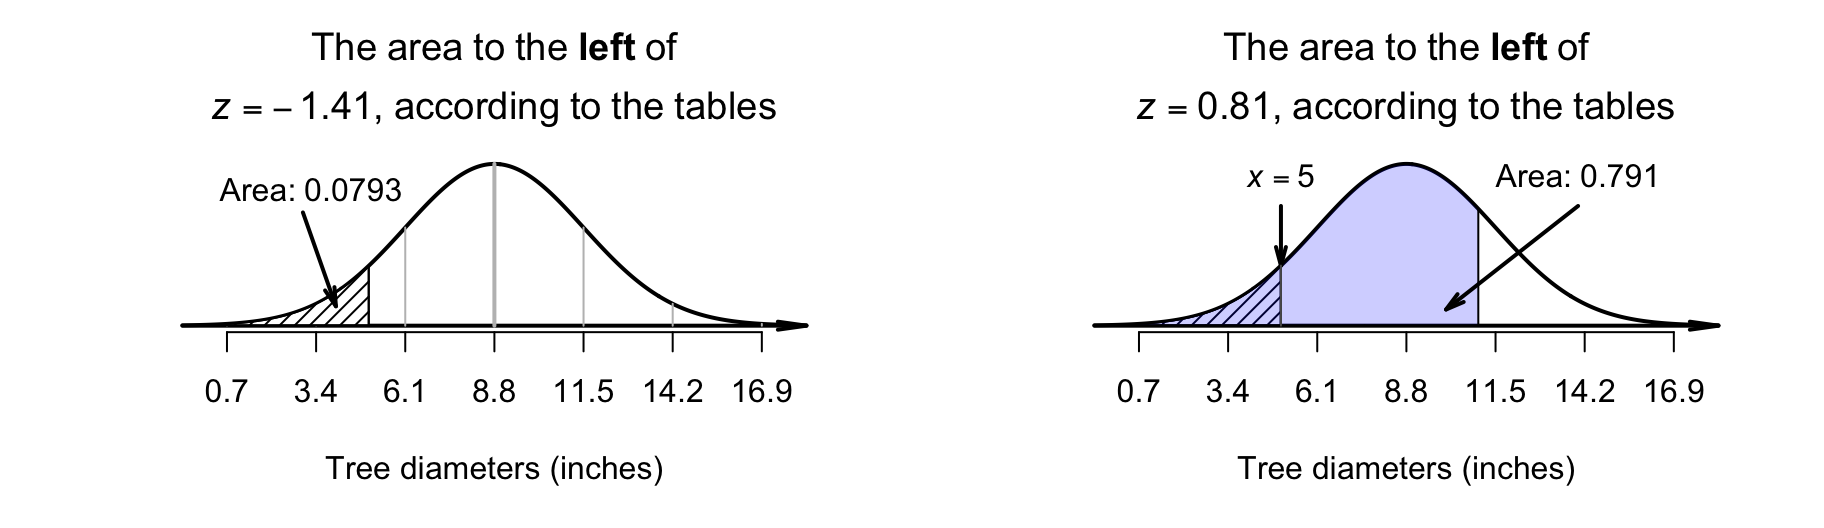
The tables in Appendices Section B.1 and Section B.2 can then be used to find the area to the left of \(z = -1.41\) (which is \(0.0793\)), and also to find the area to the left of \(z = 0.81\) (which is \(0.791\)). However, neither of these provide the area between\(z = -1.41\) and \(z = 0.81\text{.}\)
Looking carefully at the areas from the tables and the area sought, the required area is the area between the two \(z\)-scores (Fig. Figure 20.24): \(0.7910 - 0.0793 = 0.7117\text{.}\) The probability that a tree has a diameter between \(5\) and \(11\) inches is about \(0.7117\text{,}\) or about \(71\)%.
Figure20.24.What proportion of tree diameters are between \(5\) and \(11\) inches? Left: the hatched area is the area to the left of \(z = -1.41\text{.}\) Right: the shaded area is the area to the left of \(z = 0.81\text{.}\) Neither give us the area we seek directly.
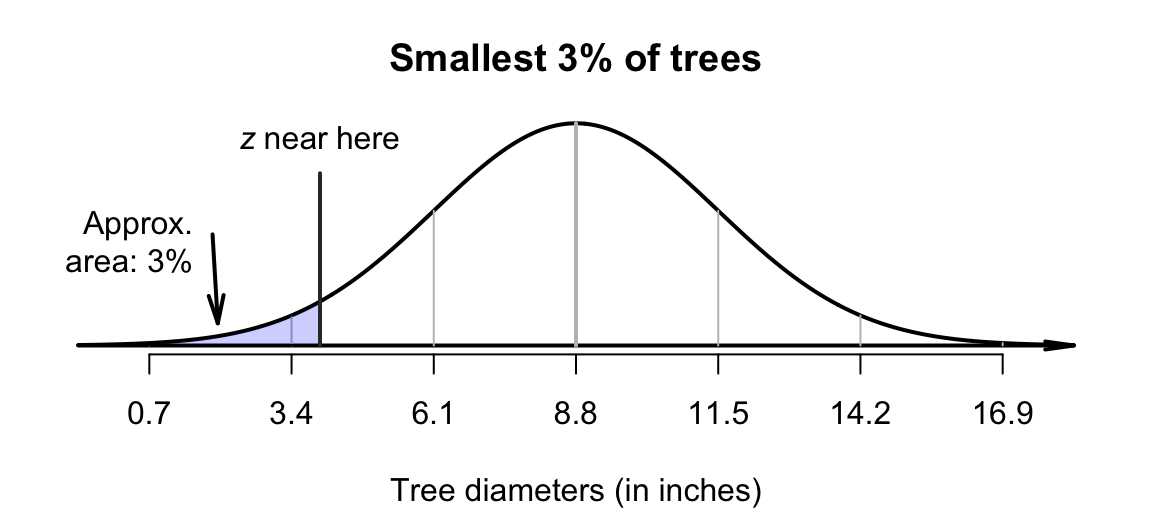
Using the model for tree diameters in Example Example 20.18 again, different types of questions can be asked too. Suppose we needed to identify the diameters of the smallest\(3\)% of trees.
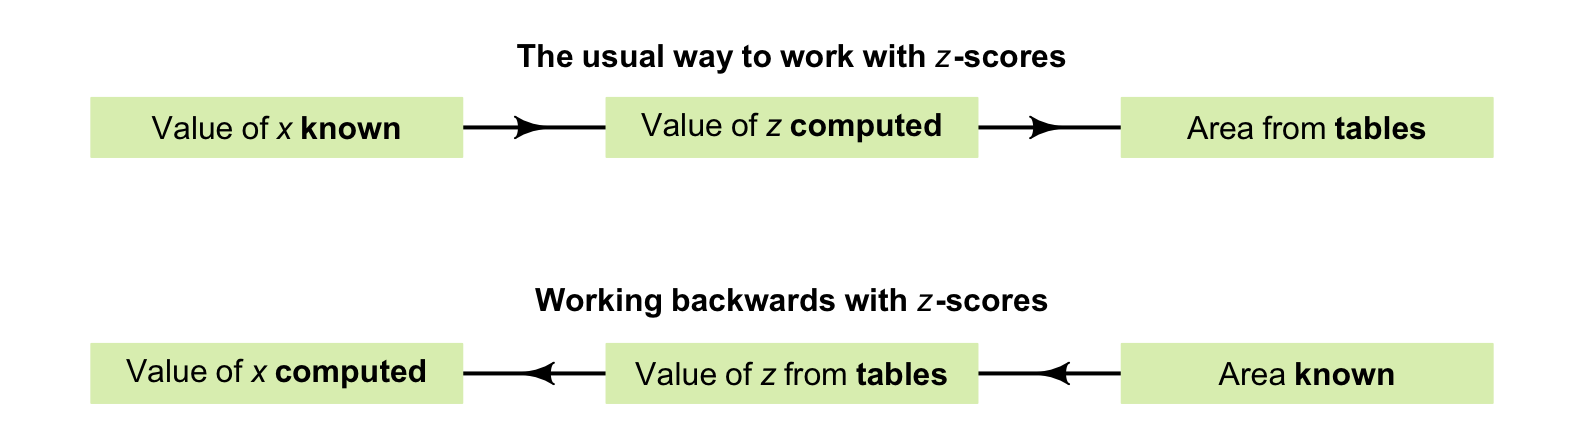
This is a different type of problem than before; previously, the tree diameter was known, so a \(z\)-score could be computed, and hence a probability (Fig. Figure 20.25). However, here the probability is known, and a tree diameter is sought. That is, working ‘backwards’ is necessary (Fig. Figure 20.25), so the \(z\)-tables need to be used ‘backwards’ too.
Figure20.25.Working with \(z\)-scores. In the tables, the areas (probabilities) are in the body of the table, and the \(z\)-scores are in the margins of the table.
Drawing a rough diagram of the situation again is very helpful (Fig. Figure 20.26). We can only mark the approximate location of the required score, but this is sufficient. Then, tables must be used to determine the corresponding \(z\)-score. Since the required value will be smaller than the mean, the \(z\)-score will be negative (to the left of the mean).
As before (Sect. Section 20.6), online tables or hard copy tables can be used (and again the online tables are easier to use). Only the hard-copy tables are explained in this book (see the online version of this book for the online tables, and instructions for their use).
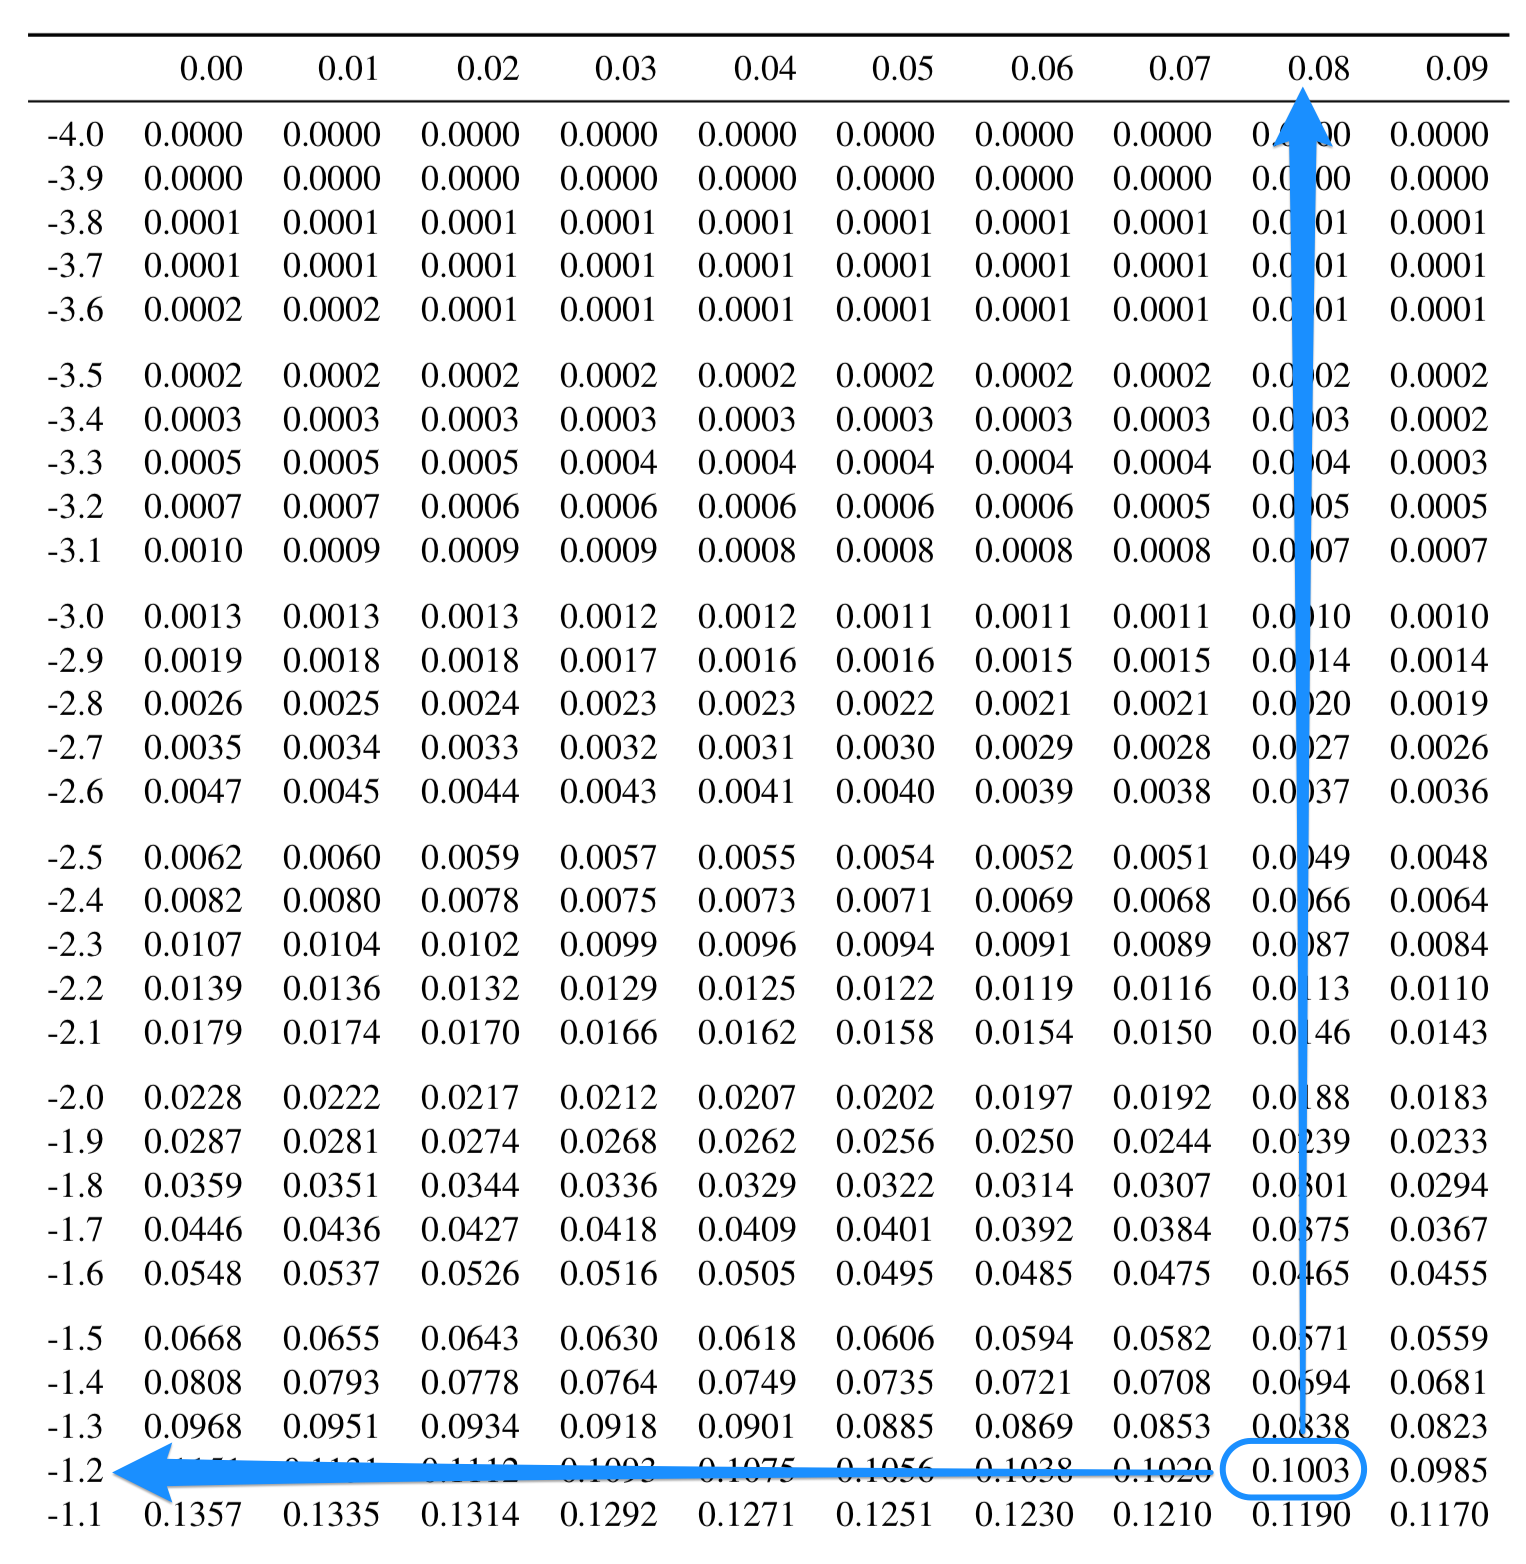
When the \(z\)-scores (in the margins of the tables in Appendices Section B.1 and Section B.2) were known, the areas were found in the body of the table. If the area, or probability (in the body of the table) is known, the corresponding \(z\)-score can be found (in the margins of the table). Using the hard copy tables (Fig. Figure 20.27), locate the area of \(0.0300\) (or as close as possible) in the body of the table, then read the \(z\)-score from the margins of the table.
Using hard copy tables, the closest value in the body of the table to \(0.0300\) (or \(3\)%) is \(0.0301\text{.}\) This corresponds to a \(z\)-score of \(z = -1.88\) (from the margins of the table). Sometimes, the exact area can be found in the body of the table, but often the closest value in the body of the table must be used. (The online tables give a slightly more precise value of \(z = -1.881\text{.}\))
Using either the hard-copy or online tables, the appropriate \(z\)-value is about \(-1.88\) standard deviations below the mean; that is, \(z = -1.88\) (Fig. Figure 20.26). The \(z\)-score can be converted to an observation value \(x\) using the unstandardising formula: 1
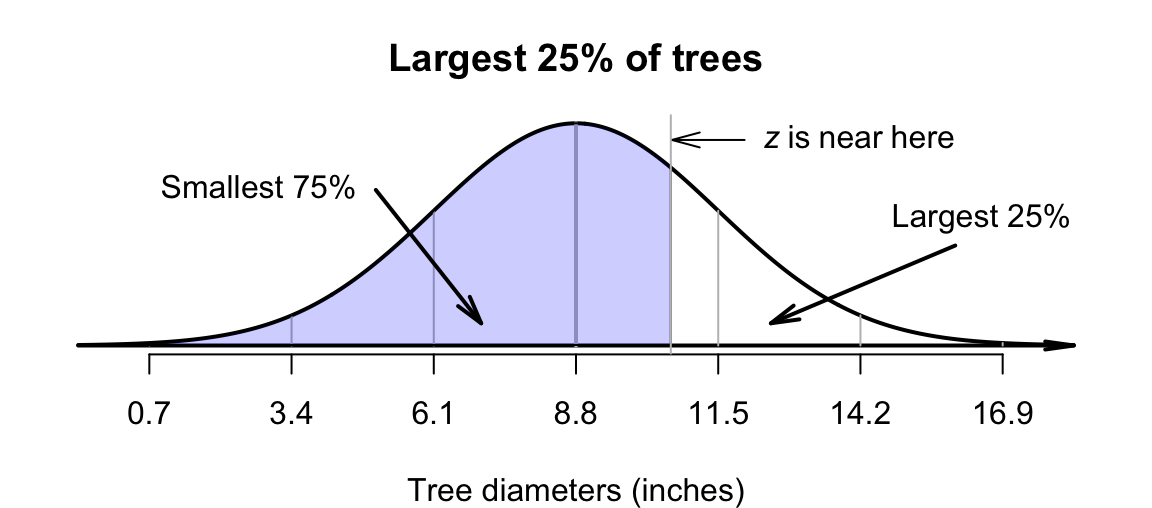
The situation can be drawn (Fig. Figure 20.31). Since an area is given, we need to work ‘backwards’, so the \(z\)-tables need to be used ‘backwards’ too. The largest\(25\)% implies large trees, so the required diameter is larger than the mean (so corresponds to a positive \(z\)-score).
The tables work with the area to the left of the value of interest, which is \(75\)% (Fig. Figure 20.31). Using either the hard-copy or online tables, the appropriate \(z\)-value is \(z = 0.674\text{.}\) Then, the \(z\)-score can be converted to an observation value \(x\) using the unstandardising formula:
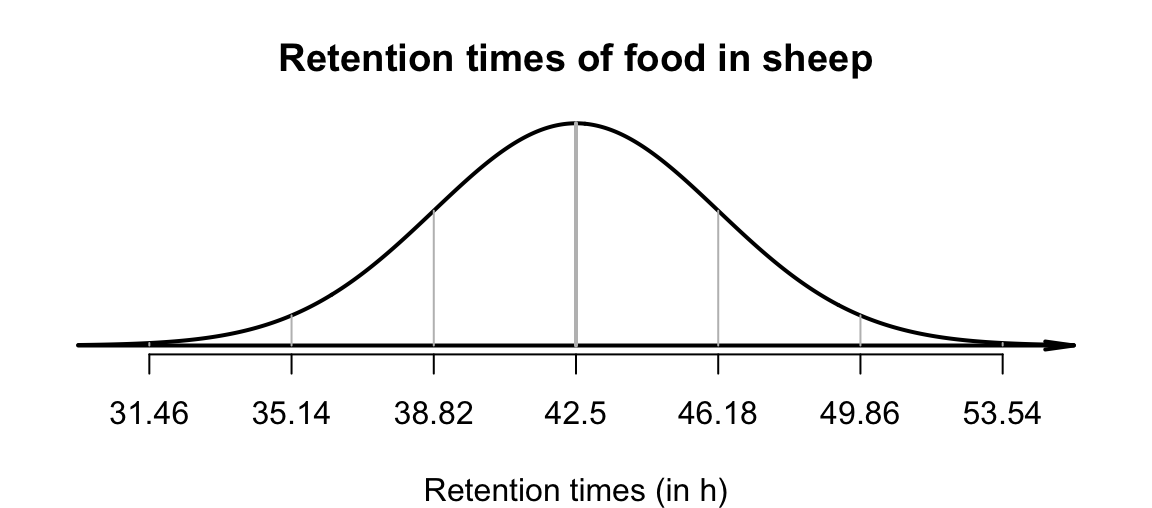
[172] modelled the retention time of food in sheep, using a normal distribution with the mean retention time as \(\mu = 42.5\) h, and the standard deviation as \(\sigma = 3.68\) h. We can draw this normal distribution (Fig. Figure 20.32), and then apply the \(68\)–\(95\)–\(99.7\) rule:
\begin{equation*}
z = \frac{40 - 42.5}{3.68} = -0.68.
\end{equation*}
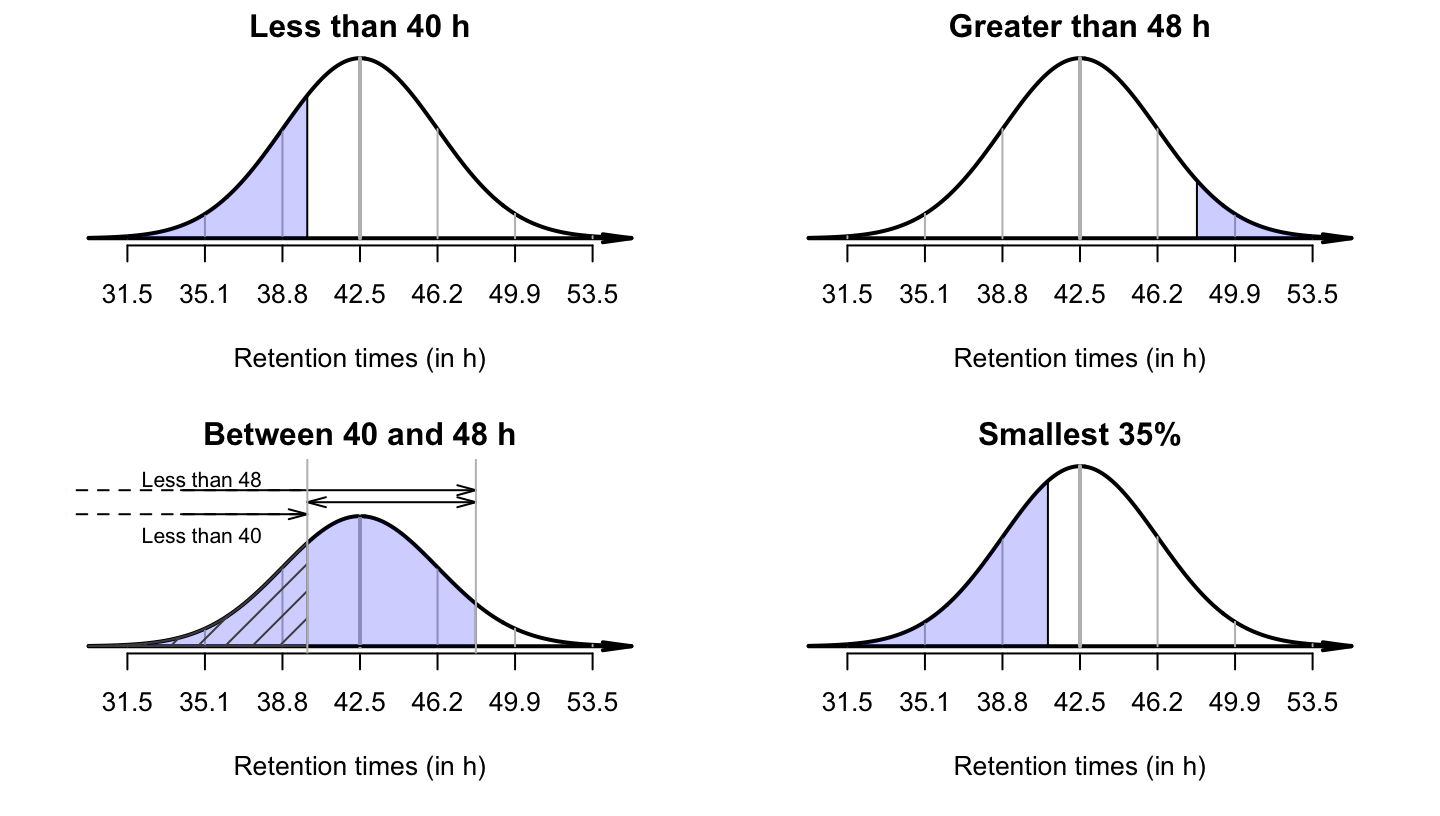
This is a negative number, since \(40\) h is below the mean. Using the tables in Appendices Section B.1 and Section B.2 (that give the area to the left of the \(z\)-score), the area to the left of \(z = -0.68\) is \(0.2483\text{,}\) or about \(24.8\)%. About \(24.8\)% of sheep have a retention time less than \(40\) h.
A retention time of \(48\) h corresponds to a \(z\)-score of \(1.49\text{.}\) Using the normal distribution tables, the area to the left of this \(z\)-score is \(0.9319\text{,}\) so the area to the right of this \(z\)-score is \(0.0681\) (Fig. Figure 20.37, top right panel).
A retention time of \(40\) h corresponds to \(z = -0.68\) and, using the normal distribution tables, the area to the left of \(z = -0.68\) is \(0.2483\) (Fig. Figure 20.37, bottom left panel; hatched area). But this is not the area that we seek. From earlier, the area to the left of \(z = 1.49\) is \(0.9319\) (Fig. Figure 20.37, bottom left panel; shaded region). But this is not the area we seek either. From the two areas that we know, we can find the area that we seek (Fig. Figure 20.37, bottom left panel):
The time we seek must be smaller than the mean if it defines the shortest\(35\)% of retention times. We don’t know exactly where to draw the retention time that this corresponds to on the diagram; it’s just somewhere to the left of the mean (Fig. Figure 20.37, bottom right panel).
This time, we know the area to the left, but we do not know the value (or \(z\)-score). This a ‘backwards problem’, and we need to find the \(z\)-score ‘backwards’ (Sect. Section 20.8). From the hard copy tables, a \(z\)-score of \(z = -0.39\) has an area to the left of \(0.3483\text{,}\) which is as close as we can get. (The online tables are more precise: \(z = -0.385\text{.}\))
A model is a way of describing the theoretical distribution of some quantitative quantity. One common model is a normal model or normal distribution, which is a bell-shaped distribution with a theoretical mean \(\mu\) and a theoretical standard deviation \(\sigma\text{.}\) Probabilities can be computed from normal distributions using \(z\)-scores, the \(68\)–\(95\)–\(99.7\) rule, or tables.
Consider again the model for tree diameters in Example Example 20.18[87]: a normal distribution with \(\mu = 8.8\) inches, and \(\sigma = 2.7\) inches.
Growth charts released by the World Health Organisation[178] showed that girls aged five-years-old with a height of \(100\) cm are said to have a \(z\)-score of \(z = -2\text{.}\) What does this mean?
Growth charts released by the World Health Organisation[178] showed that girls aged five-years old with a height of \(120\) cm are said to have a \(z\)-score of \(z = +2\text{.}\) What does this mean?
The \(68\)–\(95\)–\(99.7\) rule states that approximately\(68\)% of observations are within one standard deviation of the mean. Use the tables in Appendices Section B.1 and Section B.2 to compute a more precise value for the percentage of observations within one standard deviation of the mean. Comment.
The \(68\)–\(95\)–\(99.7\) rule states that approximately\(95\)% of observations are within two standard deviations of the mean. Use the tables in Appendices Section B.1 and Section B.2 to compute a more precise value for the percentage of observations within two standard deviations of the mean. Comment.
Consider again the study by [87] (Example Example 20.18), who studied the diameter of trees in certain forests. The tree diameters can be modelled as having a normal distribution, with a mean of \(\mu = 8.8\) inches, and a standard deviation of \(\sigma = 2.7\) inches. Using this model, answer these questions.
[173] simulated methods for coating corn seeds (with fertiliser and crop protection chemicals, etc.). The seed diameter was modelled with a normal distribution, with mean \(7.5\) mm and standard deviation of \(0.225\) mm. Using this model, answer these questions.
[174] studied factors influencing preterm births. They modelled the gestation length of healthy babies with a normal distribution, having a mean of \(40\) weeks, and a standard deviation of \(1.64\) weeks. Using this model, answer these questions.
According to Health Direct, ‘Babies born between \(32\) and \(37\) weeks may need care in a special care nursery’. What proportion of healthy births would be expected to be born between \(32\) and \(37\) weeks gestation?
A new method for evaluating bridge loads [175] used a simulation to compare the new method to an existing method. For the simulation, they modelled the gross vehicle mass (GVM) of trucks as having a normal distribution, with a mean of \(13\) tonnes and a standard deviation of \(1.3\) tonnes.
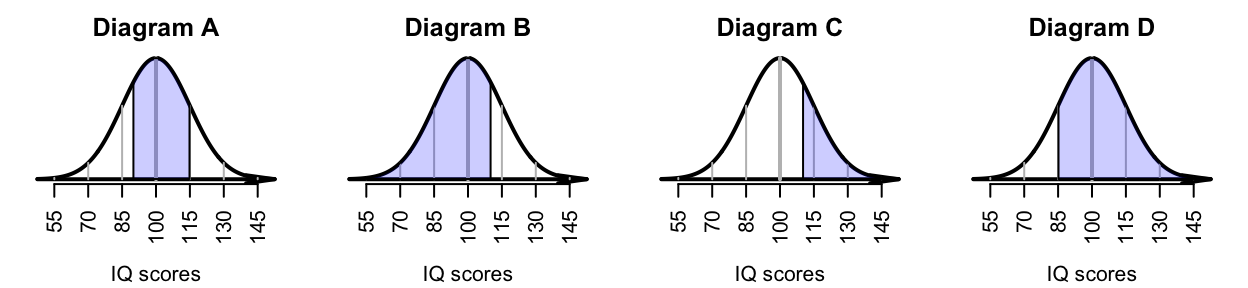
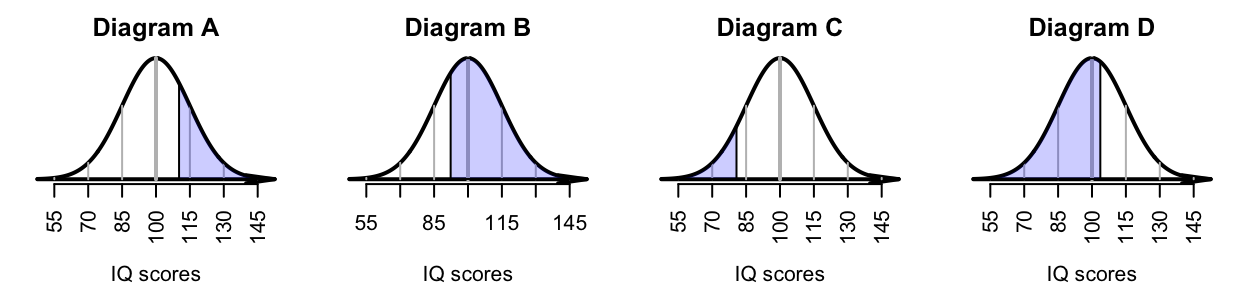
IQ scores are designed to have a mean of \(100\) and a standard deviation of \(15\text{.}\)Mensa is a society for people with a high IQ; specifically, for people who have ‘attained a score within the upper two percent of the general population’ (Mensa webpage: https://www.mensa.org/). What IQ score is needed to join Mensa?
IQ scores are designed to have a mean of \(100\) and a standard deviation of \(15\text{.}\)[179] reports that the US Military must ‘reject all military recruits whose IQ is in the bottom \(10\)% of the population’ ([179], p. 403). What IQ scores lead to a rejection from the US military?
A study of the impact of charging electric vehicles (EVs) on electricity demands [176] modelled the time at which people began charging their EVs at home. Based on a survey [177], they modelled the time at which EVs began charging as having a mean of 5:30 pm, with a standard deviation of \(2.28\) h. For this model: