You have learnt to ask an RQ, design a study, classify and summarise the data, construct confidence intervals, and conduct hypothesis tests. In this chapter, you will learn to:
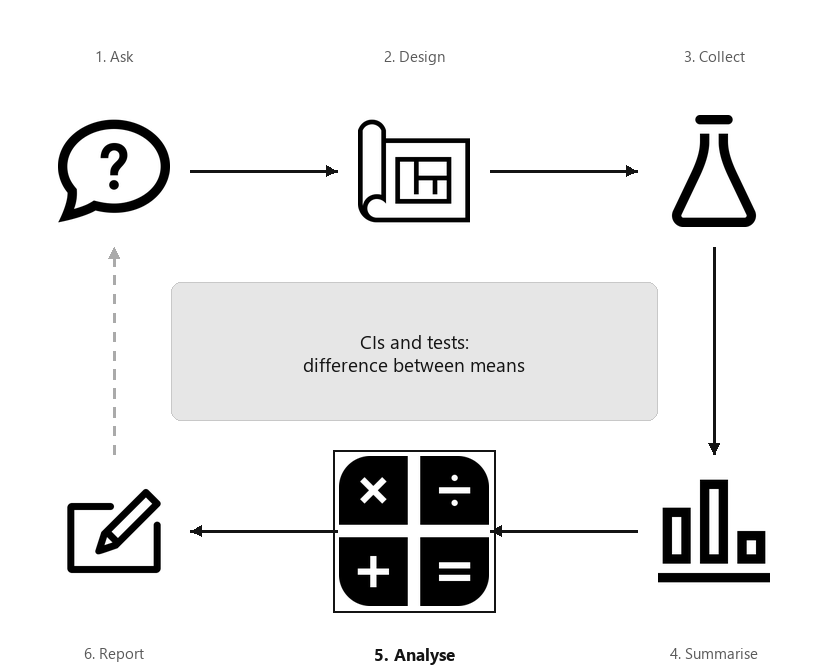
A diagram showing the six steps of research, arranged in a cycle: Ask, Design, Collect, Classify and summarise, Analyse, Report. Step 5 (Analyse) is highlighted, captioned “CIs and tests: difference between means”.
Some Mexican garter snakes (Thamnophis melanogaster) live in habitats with no crayfish, while some live in habitats with crayfish and hence use crayfish as a food source. [121] were interested in whether the snakes in these two regions were different:
Two different groups of snakes are studied, so this is a relational RQ (the study uses a between-individuals comparison) with no intervention, and the data are shown below.
[Dataset: Snakes] The raw data comprise the SVL (in cm) for each of the \(41\) female snakes living in non-crayfish regions, and each of the \(35\) female snakes living in crayfish regions.
Section30.2Summarising the data and error bar charts
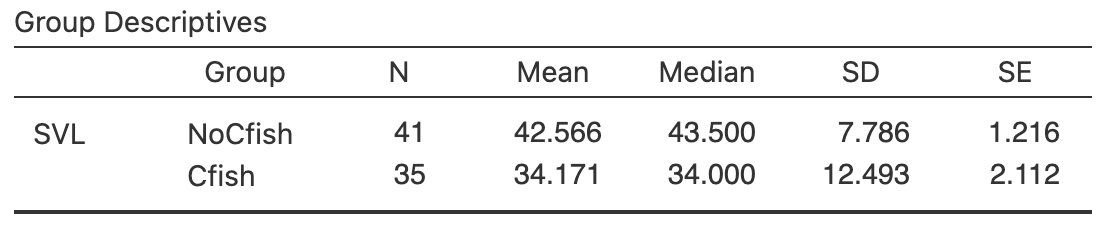
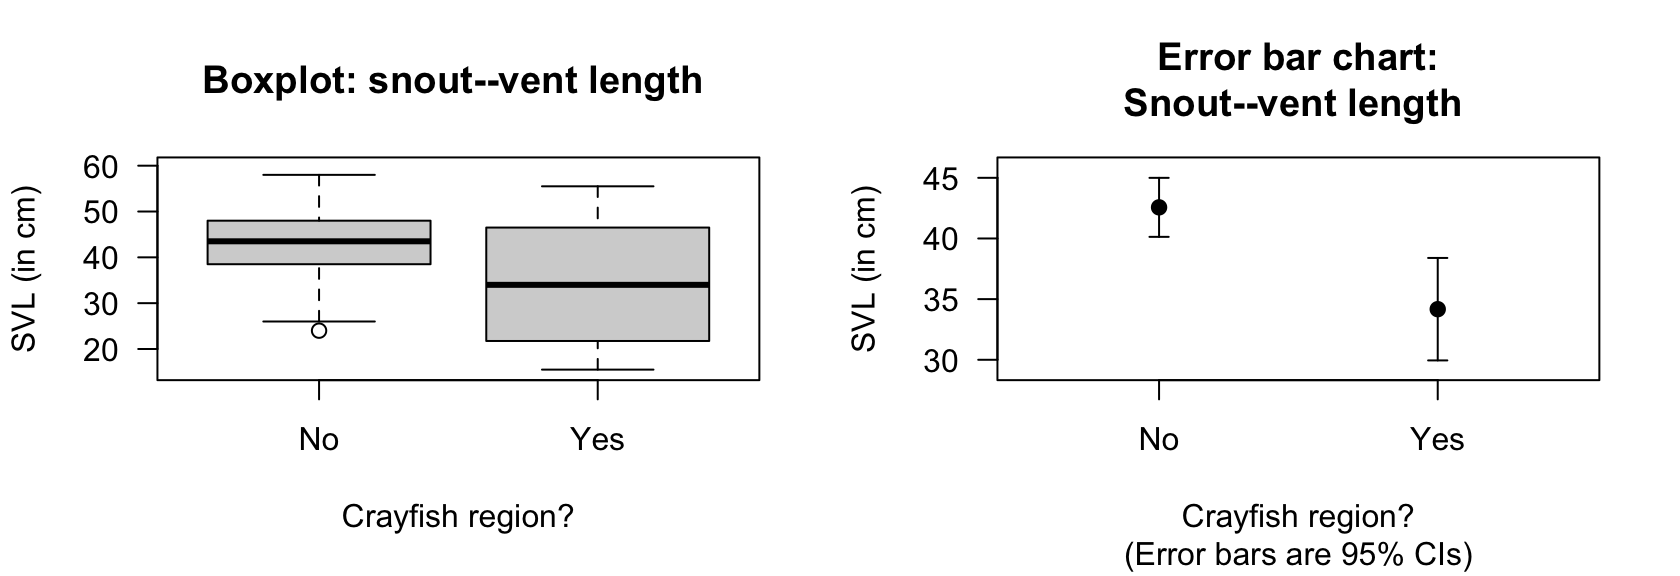
A numerical summary must summarise the difference between the means, because the RQ is about this difference. Both groups should be summarised too. The information can be found using software (Fig. Figure 30.2), and compiled into a table (Table Table 30.3). The appropriate summary for graphically summarising the data is (for example) a boxplot (Fig. Figure 30.4, left panel).
Since two groups are being compared, subscripts are used to distinguish between the statistics for the two groups; say, Groups \(1\) and \(2\) in general (Table Table 30.5). Using this notation, the parameter in the RQ is the difference between population means: \(\mu_1 - \mu_2\text{.}\) As usual, the population values are unknown, so this is estimated using the statistic \(\bar{x}_1 - \bar{x}_2\text{.}\)
For the garter-snakes data, define the differences as the mean for females snakes living in non-crayfish regions (\(N\)), minus the mean for female snakes in crayfish regions (\(C\)): \(\mu_N - \mu_C\text{.}\) This is the parameter. By this definition, the differences refer to how much larger (on average) the SVL is for snakes living in non-crayfish regions.
Here the difference is computed as the mean SVL for snakes living in non-crayfish regions, minus the mean SVL for snakes living in crayfish regions. Computing the difference as the mean SVL for snakes in crayfish regions, minus non-crayfish regions is also correct.
You need to be clear about how the difference is computed, and be consistent throughout. The meaning of the conclusions will be the same whichever direction is used.
A useful way to compare the means of two (or more) groups is to display the CIs for the means of the groups being compared in an error bar chart. Error bars charts display the expected variation in the sample means from sample to sample, while boxplots display the variation in the individual observations. For the garter-snakes data, the error bar chart (Fig. Figure 30.4, right panel) shows the \(95\)% CI for each group; the mean appears as a dot.
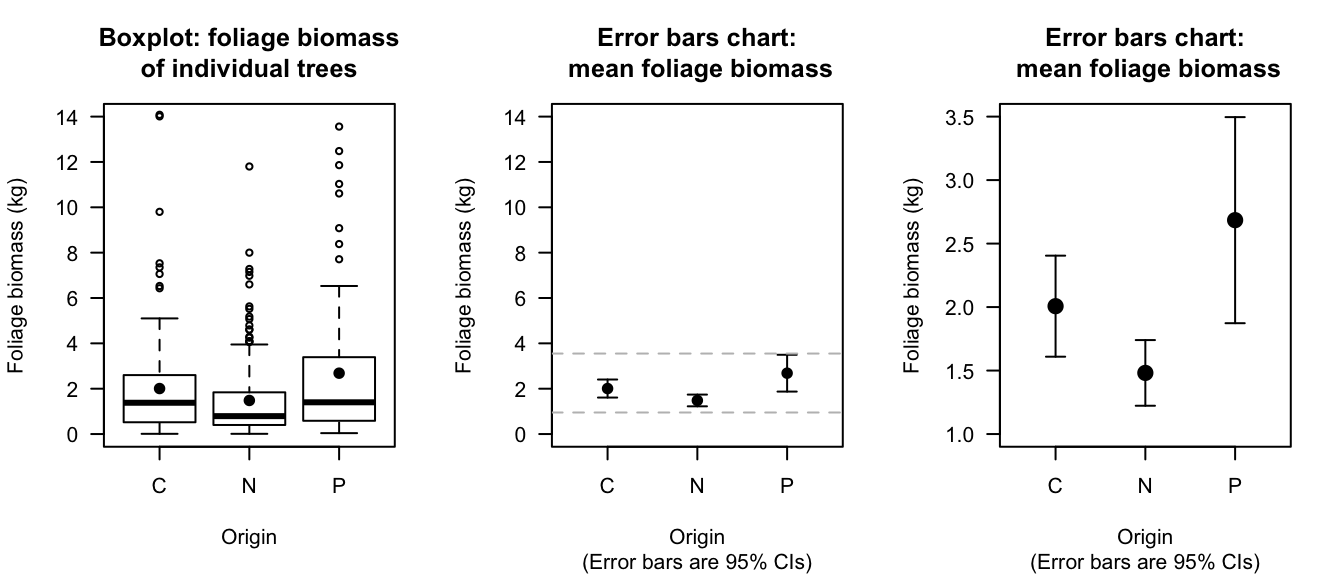
[151] studied the foliage biomass of small-leaved lime trees from three sources: coppices; natural; planted. Three graphical summaries are shown in Fig. Figure 30.8: a boxplot (showing the variation in individual trees; left), an error bar chart (showing the variation in the sample means; centre) on the same vertical scale as the boxplot, and the same error bar chart using a more appropriate scale for the error bar plot (right).
Figure30.8.Boxplot (left) and error bar charts (centre; right) comparing the mean foliage biomass for small-leaved lime trees from three sources (C: Coppice; N: Natural; P: Planted). The centre panel shows an error bar chart using the same vertical scale as the boxplot; the dashed horizontal lines are the limits of the error bar chart on the right. The right error bar chart uses a more appropriate scale on the vertical axis. The solid dots show the mean of the distributions.
Section30.3Confidence intervals for \(\mu_1 - \mu_2\)
Each sample will comprise different snakes, and give different SVLs. The sample means for each group will differ from sample to sample, and the difference between the sample means will be different for each sample also. The difference between the sample means varies from sample to sample, and so has a sampling distribution and a standard error.
Definition30.9.Sampling distribution for the difference between two sample means.
The sampling distribution of the difference between two sample means\(\bar{x}_1\) and \(\bar{x}_2\) is (when the appropriate conditions are met; Sect. Section 30.5) described by:
with a standard deviation, called the standard error of the difference between the means, of \(\displaystyle\text{s.e.}(\bar{x}_1 - \bar{x}_2)\text{.}\)
The sampling distribution describes how the values of \(\bar{x}_N - \bar{x}_C\) vary from sample to sample. Then, finding a \(95\)% CI for the difference between the mean SVLs is similar to the process used in Chap. Chapter 23, since the sampling distribution has an approximate normal distribution:
The difference between mean SVLs is \(8.39\) cm, shorter for those living in a crayfish region (mean: \(34.17\) cm; s.e.: \(2.112\text{;}\)\(n = 35\)) compared to those not living in a crayfish region (mean: \(42.57\) cm; s.e.: \(1.216\text{;}\)\(n = 41\)), with an approximate\(95\)% CI for the difference between mean SVLs from \(3.52\) to \(13.27\) cm.
The plausible values for the difference between the two population means SVLs are between \(3.52\) to \(13.27\) cm (shorter for those living in crayfish regions).
Giving the CI alone is insufficient; the direction in which the differences were calculated must be given, so readers know which group had the higher mean.
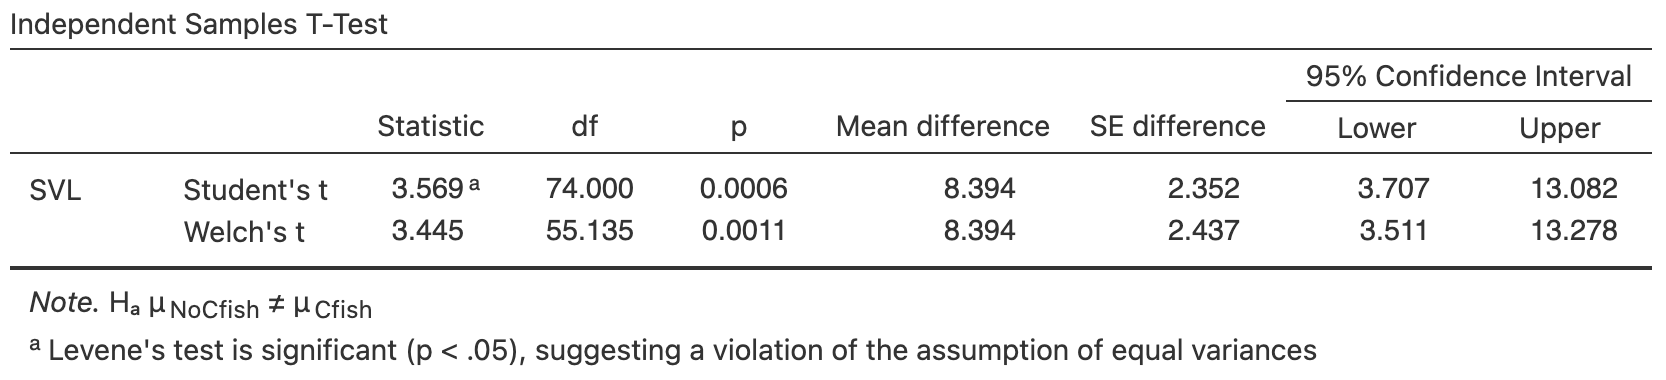
Output from software often shows two CIs for the difference between the two means (Fig. Figure 30.2). We will use the results from Welch’s test (the second row), as this row of output is more general, and makes fewer assumptions, than the results in the first row. The information in the second row makes fewer assumptions, and is more widely applicable.
Most software gives two CIs: one assuming the standard deviations in the two groups are the same (Student’s), and another not assuming the standard deviations in the two groups are the same (Welch’s).
We will use the information that does not assume the standard deviations in the two groups are the same. In the software output in Fig. Figure 30.2, this is the second row of the top table (labelled ’Welch’s \(t\)’). (The information in both rows are often similar anyway.)
From the output, the \(95\)% CI for the difference is from \(3.51\) to \(13.28\text{.}\) The approximate CI and the exact (from software) CIs are only slightly different, as the samples sizes are not too small. (Recall: the \(t\)-multiplier of \(2\) is an approximation, based on the \(68\)–\(95\)–\(99.7\) rule.)
As always, the null hypothesis is the default ’no difference, no change, no relationship’ position; any difference between the parameter and statistic is due to sampling variation (Sect. Section 28.2). Hence, the null hypothesis is ’no difference’ between the population mean SVL of the two groups:
The alternative hypothesis proposes that any difference between the sample means is because a difference really exists between the population means. The alternative hypothesis is two-tailed, based on the RQ.
The difference between the sample mean SVLs in the two groups depends on which one of the many possible samples is randomly obtained, even if the difference between the means in the population is zero. The difference between the sample means is \(8.394\) cm, but this difference will vary from sample to sample; that is, sampling variation exists.
Most software gives two hypothesis test results: one assuming the standard deviations in the two groups are the same, and another not assuming the standard deviations in the two groups are the same.
We will use the information that does not assume the standard deviations in the two groups are the same. In the software output in Fig. Figure 30.2, this is the second row of the bottom table (labelled ’Welch’s \(t\)’). (The information in both rows are often similar anyway.)
The observed difference between sample means, relative to what was expected, is found by computing the test statistic; in this case, a \(t\)-score. The software output (Fig. Figure 30.2) gives the \(t\)-score, but the \(t\)-score can also be computed using the information in Table Table 30.3:
A \(P\)-value determines if the sample statistic is consistent with the assumption (i.e., \(H_0\)). Since the \(t\)-score is large, the \(P\)-value will be small using the \(68\)–\(95\)–\(99.7\) rule (and less than \(0.003\)). This is confirmed by the software (Fig. Figure 30.2): the two-tailed \(P\)-value is \(0.0011\text{.}\)
A small \(P\)-value suggests the observations are inconsistent with the assumption of no difference (Table Table 28.15), and the difference between the sample means could not be reasonably explained by sampling variation, if \(\mu_N - \mu_C = 0\text{.}\)
Strong evidence exists in the sample (two independent samples \(t = 3.445\text{;}\) two-tailed \(P = 0.0011\)) that the population mean SVL is different for female snakes living in crayfish regions (mean: \(34.17\) cm; \(n = 35\)) and non-crayfish regions (mean: \(42.57\) cm; \(n = 41\text{;}\)\(95\)% CI for the difference: \(3.51\) to \(13.28\) cm longer for those in non-crayfish regions).
The conclusion contains an answer to the RQ, the evidence leading to this conclusion (\(t = 3.44\text{;}\) two-tailed \(P = 0.0011\)), and sample summary statistics, including a CI.
when one or both groups have \(25\) or fewer observations, and the populations corresponding to the groups with samples sizes under \(25\) have an approximate normal distribution.
This condition ensures that the distribution of the difference between sample means has an approximate normal distribution (so that, for example, the \(68\)–\(95\)–\(99.7\) rule can be used). The histograms of the sample data can be used to determine if normality of the populations seems reasonable. The units of analysis are also assumed to be independent (e.g., from a simple random sample).
For the garter-snakes data, both samples sizes exceed \(25\) (\(41\) and \(35\)), so the test is statistically valid. The data in each group do not need to be normally distributed, since both sample sizes are larger than \(25\text{,}\) and the data are not severely skewed (Fig. Figure 30.4, left panel).
Section30.6Tests for comparing more than two means: ANOVA
Often, more than two means need to be compared. This requires a different method, called analysis of variance (or anova). The details are beyond the scope of this book. In this section, a very brief overview of using a one-way anova is given, using an example. Importantly, this example shows that the basic principles of hypothesis testing from Chap. Chapter 28 still apply.
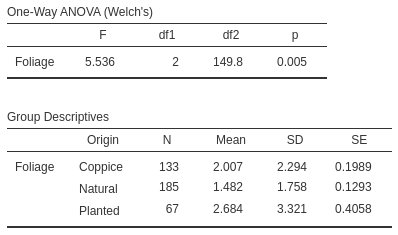
[Dataset: Lime] [151] studied the foliage biomass of small-leaved lime trees from three sources: coppices (\(C\)); natural (\(N\)); planted (\(P\)); see Example Example 30.7. A boxplot and error bar chart are shown in Fig. Figure 30.8. A numerical summary is shown in Table Table 30.17 (based on the output in Fig. Figure 30.16).
The alternative hypothesis is that the three means are not all equal. This hypothesis encompasses many possibilities: for example, that the three means are all different from each other, or that the first is different from the other two (which are the same). Because the alternative hypothesis encompasses many possibilities, we write:
Performing an anova using software (Fig. Figure 30.16) gives \(P = 0.005\text{.}\) (The test statistic here is an \(F\)-score; we don’t discuss these further, but the \(F\)-score measures the overall difference between the three means.) The small \(P\)-value in this context means the same as usual (Sect. Section 28.6): there is persuasive evidence to support the alternative hypothesis (that the three means are not all equal).
While we know the means are not all the same, we do not know which group means are different from which other group means. One option might be to compare all possible combinations of two groups (i.e., the means of groups \(C\) and \(N\text{;}\) the means of groups \(C\) and \(P\text{;}\) the means of groups \(N\) and \(P\)) using three separate two-sample \(t\)-tests. While this approach is possible, it increases the probability of declaring a false positive (i.e., of making a Type I error; Sect. Section 28.7): incorrectly declaring that a difference exists between two sets of means. The correct approach requires methods beyond this book.
To reduce vehicle speeds on freeway exit ramps, [120] studied the impact of additional signage. At one site (Ningxuan Freeway), speeds were recorded for \(38\) vehicles before the extra signage was added, and then for \(41\) different vehicles after the extra signage was added.
The data are not paired: different vehicles are measured before (\(B\)) and after (\(A\)) the extra signage is added. Define \(\mu\) as the mean speed (in km.h\(^{-1}\)) on the exit ramp, and the parameter as \(\mu_B - \mu_A\text{,}\) the reduction in the mean speed.
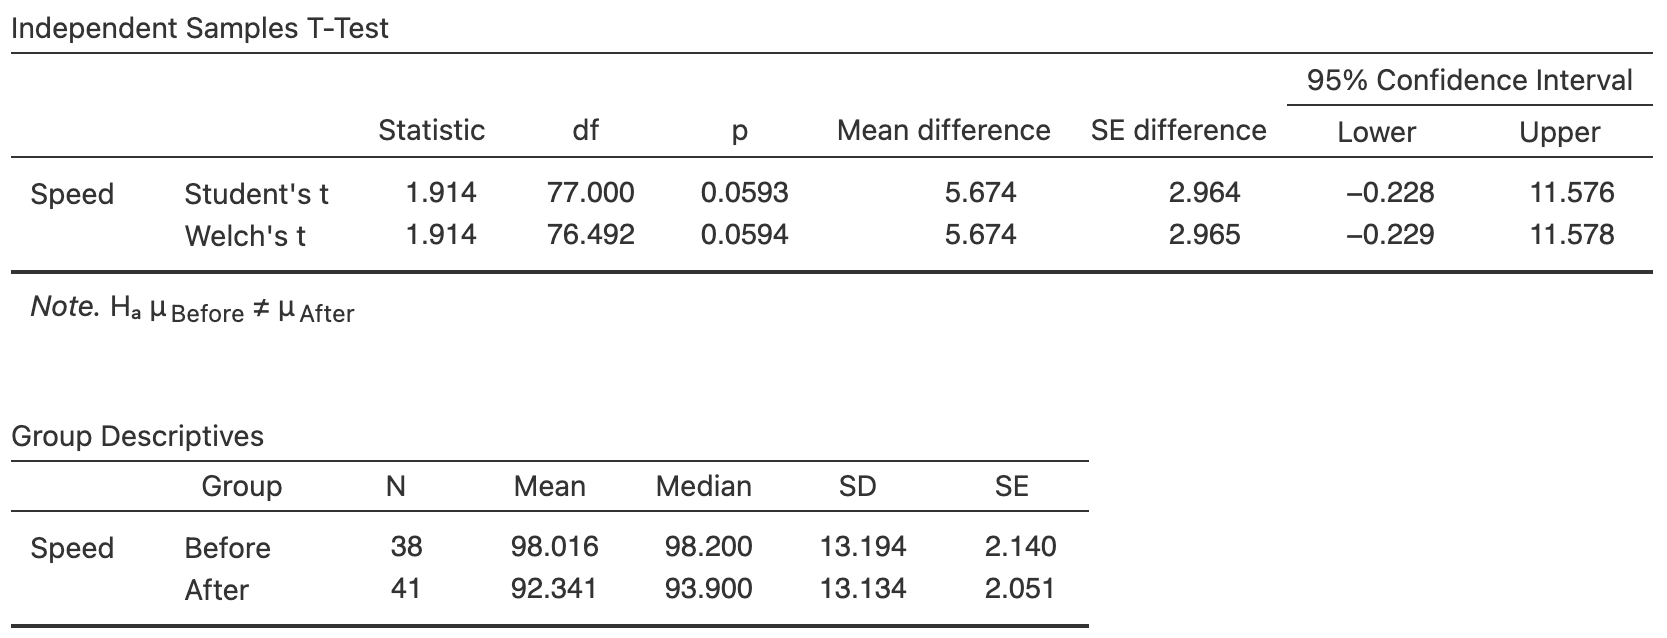
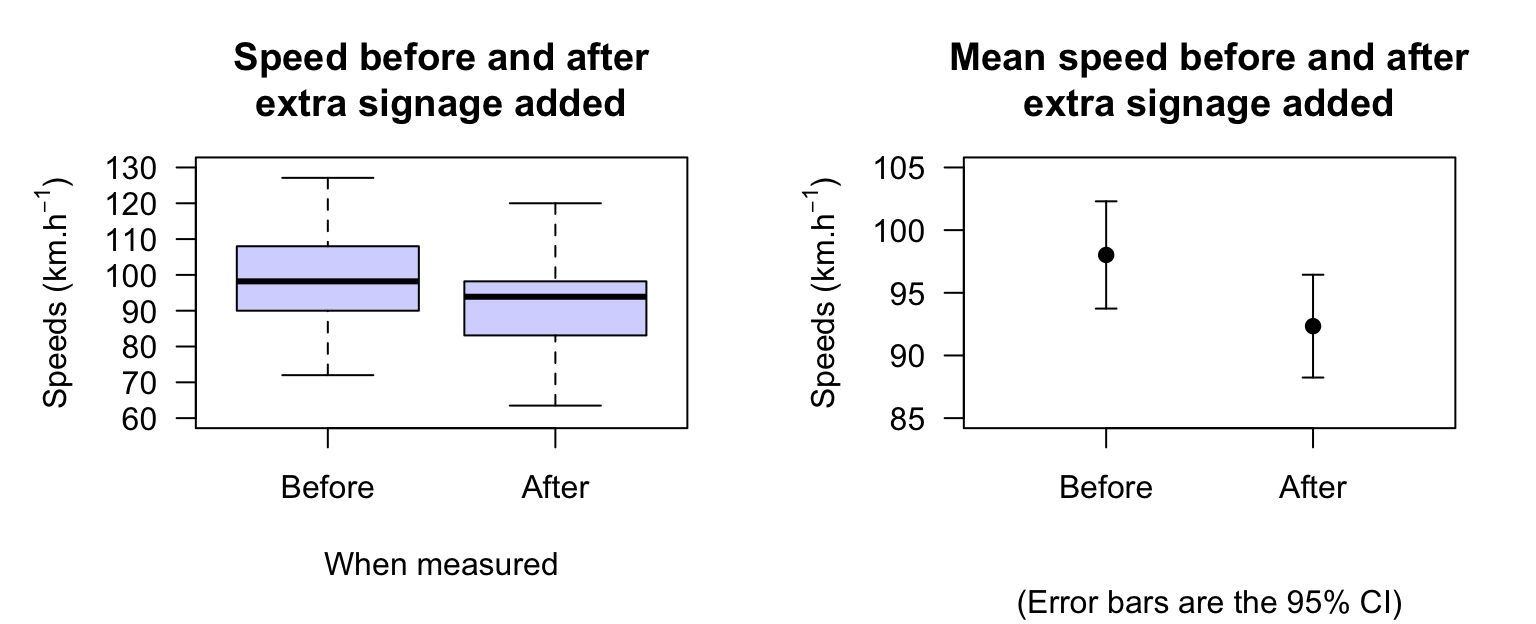
as in the output table (Row 2). A boxplot of the data is shown in Fig. Figure 30.20 (left panel), and an error bar chart in Fig. Figure 30.20 (right panel).
Figure30.20.Boxplot (left) and error bar chart (right) showing the mean speed before and after the addition of extra signage, and the \(95\)% CIs. The vertical scales on the two graphs are different.
or from \(-0.25\) to \(11.60\) km.h\(^{-1}\text{.}\) (This is very similar to the \(95\)% CI shown in Fig. Figure 30.18.) The negative value is not a negative speed. Since the difference between the means is defined as a reduction, this CI means that the reduction in the populations mean speed is likely between \(-0.25\) to \(11.64\) km.h\(^{-1}\text{.}\) Since a negative reduction is an increase, this is more easily understood as the difference being located between a \(0.25\) km.h\(^{-1}\)increase before the signage was added to an \(11.64\) km.h\(^{-1}\)reduction after the signage was added.
The best estimate of the difference in population means is the difference between the sample means: \((\bar{x}_B - \bar{x}_A) = 5.68\text{.}\) Since \(\text{s.e.}(\bar{x}_B - \bar{x}_A) = 2.965\text{,}\) the \(t\)-score is
Remembering that the alternative hypothesis is one-tailed, the \(P\)-value (using the \(68\)–\(95\)–\(99.7\) rule) is larger than \(0.025\text{,}\) but smaller than \(0.32\text{,}\) so making a clear decision is difficult without using software. However, since the \(t\)-score is just less than 2, we suspect that the \(P\)-value is likely to be closer to \(0.025\) than to \(0.32\text{.}\)
From software, \(P = 0.0297\) (you cannot be this precise just using the \(68\)–\(95\)–\(99.7\) rule). Using Table Table 28.15, this \(P\)-value provides moderate evidence of a reduction in mean speeds. We conclude:
Moderate evidence exists in the sample (\(t = 1.91\text{;}\) one-tailed \(P = 0.030\)) that mean speeds have reduced after the addition of extra signage (mean reduction: \(5.67\) km.h\(^{-1}\text{;}\)\(95\)% CI for the difference: \(-0.23\) to \(11.6\) km.h\(^{-1}\text{;}\) s.e.: \(2.96\) km.h\(^{-1}\)). The before mean speed was \(98.02\) km.h\(^{-1}\) (\(n = 38\text{;}\) standard deviation: \(13.19\) km.h\(^{-1}\)); the after mean speed was \(92.34\) km.h\(^{-1}\) (\(n = 41\text{;}\) standard deviation: \(13.13\) km.h\(^{-1}\)).
Whether the mean speed reduction of \(5.67\) km.h\(^{-1}\) has practical importance is a separate issue. Using the validity conditions, the CI and the test are statistically valid.
(This study was seen in Sect. Section 29.8.) [354] studied patients with Type 2 diabetes mellitus (T2DM). They randomly allocated \(32\) patients into a control group (who drank hot water), and \(32\) to receive chamomile tea ([354]).
The total glucose (TG) was measured for each individual in both groups, both before the intervention and after eight weeks on the intervention. Summary data are given in Table Table 29.16. Evidence suggests that the chamomile tea group shows a mean reduction in TG (Sect. Section 29.8), while the hot-water group shows no evidence of a reduction. That is, there appears to be a difference between the two groups regarding the change in TG. However, the differences between the chamomile-tea and the hot-water groups may be due to the samples selected (i.e., sampling variation), so comparing the changes between the two groups is helpful.
Notice the RQ is one-tailed; the aim of the study is to determine if the chamomile-tea drinking group performs better (i.e., reduces the mean TG) than the control group.
This RQ is comparing two separate groups; specifically, comparing the differences between the two groups. This study contains both within-individuals comparisons (see Sect. Section 29.8) and a between-individuals comparison (this section); see Fig. Figure 30.22. This is equivalent to treating the differences for both groups as the two separate sets of data in the two-sample analysis.
Figure30.22.The chamomile-tea study has two within-individuals comparisons, and a between-individuals comparison (comparing the differences in each group).
The parameter \(\mu_T - \mu_W\) is estimated by the statistic \(\bar{x}_T - \bar{x}_W = 45.74\) mg.dL\(^{-1}\text{.}\) The standard error for the statistic was found as \(\text{s.e.}(\bar{x}_T - \bar{x}_W) = 8.42\) (using the information in Table Table 29.16). Hence, the test statistic is:
There is very strong evidence (\(t = 5.43\text{;}\) one-tailed \(P < 0.001\)) that the mean reduction in TG for the chamomile-tea drinking group (mean reduction: \(36.62\) mg.dL\(^{-1}\)) is greater than the mean reduction in TG for the hot-water drinking group (mean reduction: \(-7.12\) mg.dL\(^{-1}\text{;}\) difference between means: \(45.74\) mg.dL\(^{-1}\text{;}\) approx. \(95\)% CI: \(28.64\) to \(62.84\) mg.dL\(^{-1}\)).
To compute a confidence interval (CI) for the difference between two means, compute the difference between the two sample means, \(\bar{x}_1 - \bar{x}_2\text{,}\) and identify the sample sizes \(n_1\) and \(n_2\text{.}\) Then compute the standard error, which quantifies how much the value of \(\bar{x}_1 - \bar{x}_2\) varies across all possible samples:
where \(\text{s.e.}(\bar{x}_1)\) and \(\text{s.e.}(\bar{x}_2)\) are the standard errors of Groups \(1\) and \(2\text{.}\) The margin of error is (multiplier\({}\times{}\)standard error), where the multiplier is \(2\) for an approximate \(95\)% CI (using the \(68\)–\(95\)–\(99.7\) rule). Then the CI is:
Write the null hypothesis (\(H_0\)) and the alternative hypothesis (\(H_1\)); initially assume the value of \((\mu_1 - \mu_2)\) in the null hypothesis to be true.
Describe the sampling distribution, which describes what to expect from the difference between the sample means based on this assumption: under certain statistical validity conditions, the difference between the sample means vary with:
The \(t\)-value is like a \(z\)-score, and so an approximate \(P\)-value can be estimated using the \(68\)–\(95\)–\(99.7\) rule, or found using software. Use the \(P\)-value to make a decision, and write a conclusion.
[344] studied iron levels in Koreans with Type 2 diabetes, comparing people on a vegan (\(n = 46\)) and a conventional (\(n = 47\)) diet for \(12\) weeks. A summary of the data for iron levels are shown in Table Table 30.23.
The difference between the means in the population is denoted \(\mu_V - \mu_C\text{,}\) where \(V\) represent the vegan diet, and \(C\) represents the conventional diet.
Suppose researchers are comparing the cell diameter of lymphocytes (a type of white blood cell) and tumour cells. Define the mean diameter of lymphocytes as \(\mu_L\text{,}\) and the mean diameter of tumour cells as \(\mu_T\text{.}\)
Suppose researchers are comparing the braking distance of cars using two different types of brake pads (Type A and Type B). Define the mean breaking distance for cars with Type A brake pads as \(\mu_A\text{,}\) and mean breaking distance for cars with Type B brake pads as \(\mu_B\text{.}\)
Sketch the sampling distribution for the difference between reduction in mean TG for the tea-drinking and the hot-water drinking group (Sect. Section 30.8).
[180] measured (among other variables) the length of gray whales (Eschrichtius robustus) at birth. Are female gray whales longer than males, on average, in the population at birth? Summary information is shown in Table Table 30.24.
[30] studied the effectiveness of echinacea to treat the common cold, and compared the mean duration of the cold for participants treated with echinacea or a placebo to determine if using echinacea reduced the mean duration of symptoms. Participants were blinded to the treatment, and allocated to the groups randomly. A summary of the data is given in Table Table 30.26.
Participants were randomly allocated to one of the two groups. Pain intensity (measured using a quantitative visual analogue scale; larger values mean greater pain) were recorded after one week of treatment. The data are summarised in Table Table 30.27.
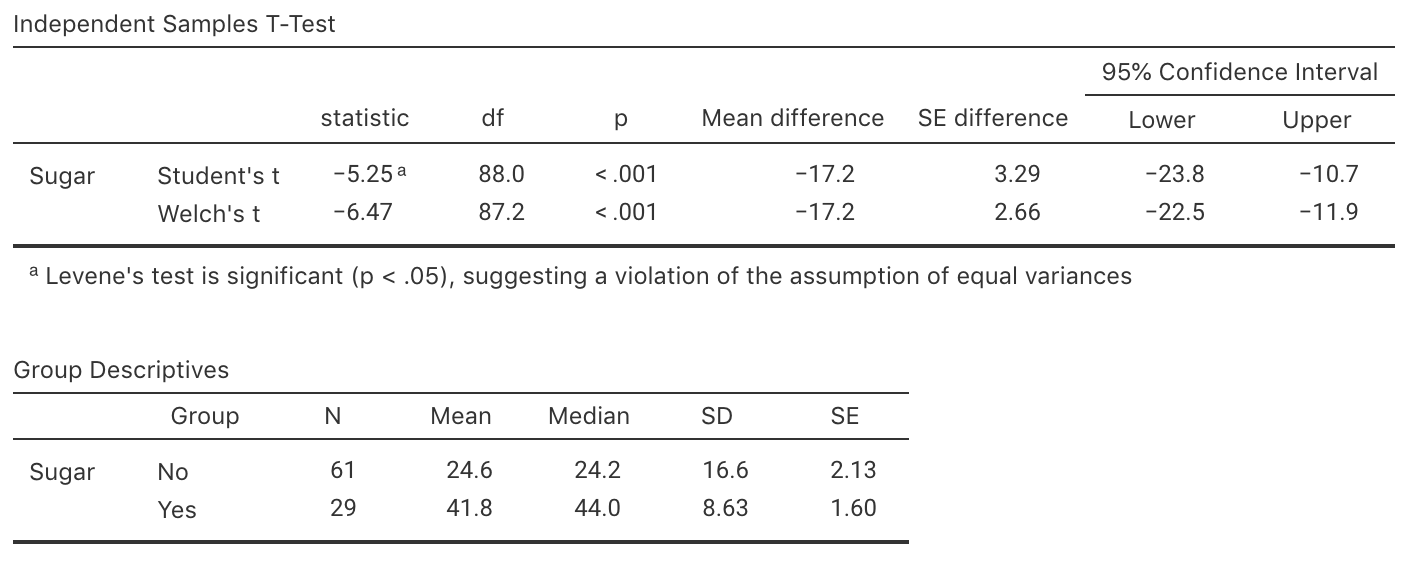
[Dataset: Dental] [129] recorded the sugar consumption in industrialised (mean: \(41.8\) kg/person/y) and non-industrialised (mean: \(24.6\) kg/person/y) countries. The software output is shown in Fig. Figure 30.28.
[Dataset: Deceleration] To reduce vehicle speeds on freeway exit ramps, [120] studied using additional signage. At one site studied (Ningxuan Freeway), speeds were recorded at various points on the freeway exit for vehicles before the extra signage was added, and then for different vehicles after the extra signage was added.
In addition, the deceleration of each vehicle was determined (Exercise Exercise 14.7.10) as the vehicle left the \(120\) km.h\(^{-1}\) speed zone and approached the \(80\) km.h\(^{-1}\) speed zone. Use the data, and the summary in Table Table 30.29, to test the RQ:
Identify clearly the parameter of interest to understand how much the deceleration increased after adding the extra signage. Remember to compute and interpret the CI for this parameter.
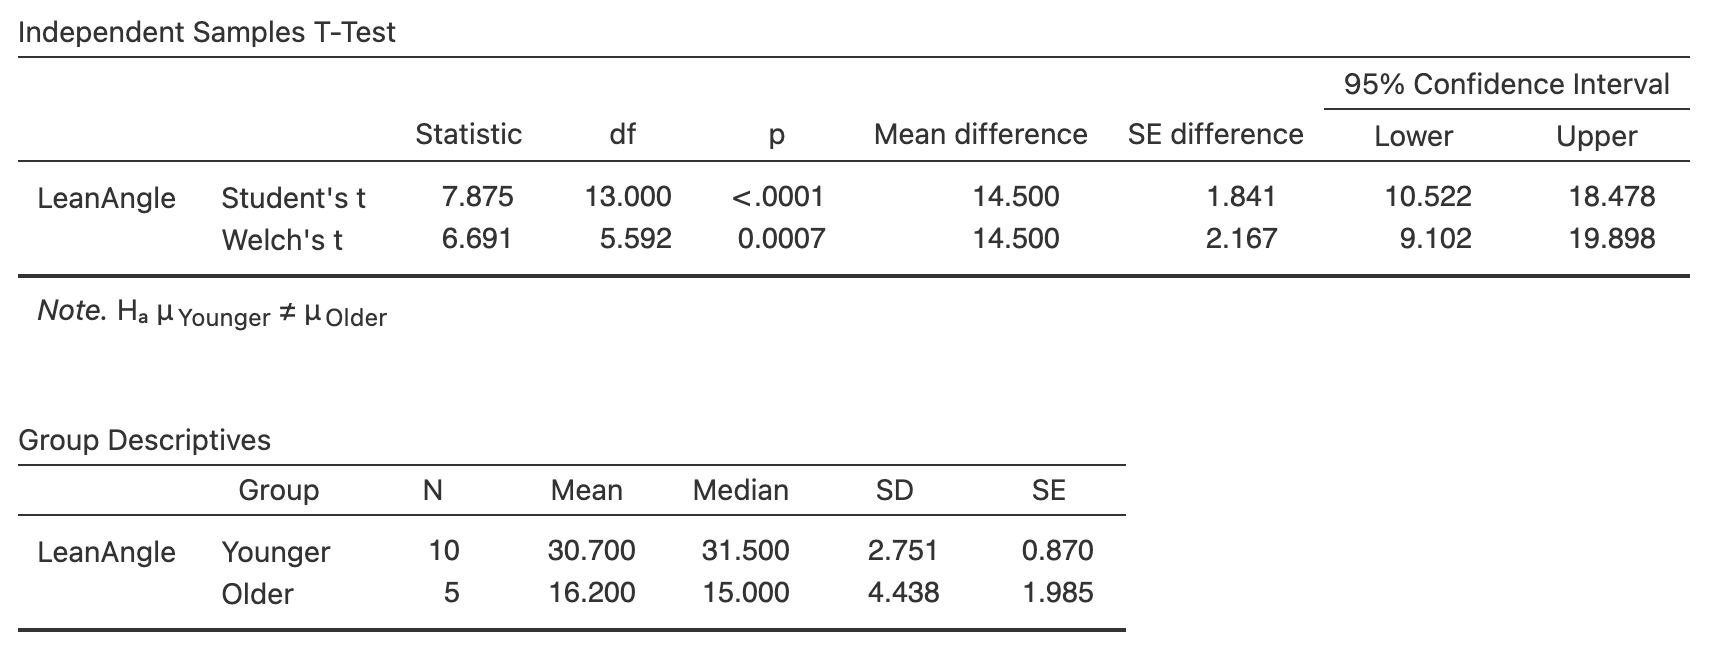
[Dataset: ForwardFall] A study [127] compared the lean-forward angle in younger and older women. An elaborate set-up was constructed to measure this lean-forward angle, using harnesses. Consider this RQ:
[324] compared the access to health promotion (HP) services for people with and without a disability in southwestern of the USA. ’Access’ was measured using the quantitative Barriers to Health Promoting Activities for Disabled Persons (bhadp) scale. Higher scores mean greater barriers to health promotion services. The RQ is:
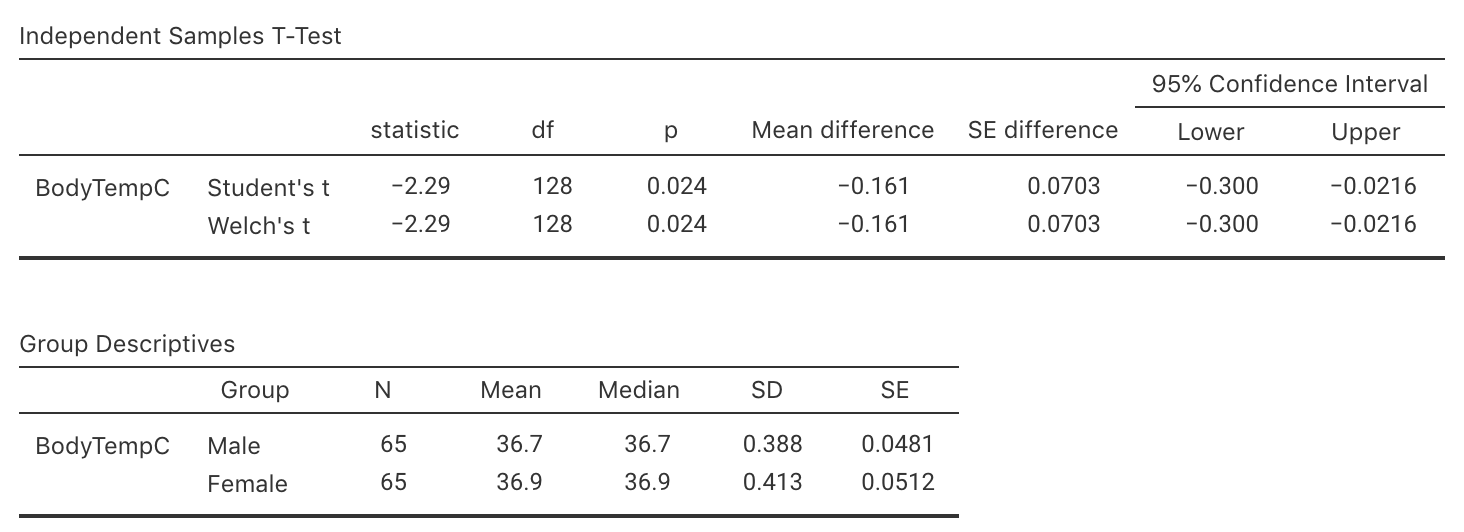
[Dataset: BodyTemp] Consider again the body temperature data from Sect. Section 27.1. The researchers also recorded the gender of the patients, as they also wanted to compare the mean internal body temperatures for females and males.
Use the software output in Fig. Figure 30.32 to perform this test and to construct an approximate \(95\)% CI appropriate for answering the RQ. Comment on the practical significance of your results.
[325] compared ’conventional’ male paramedics in Western Australia with male ’special-operations’ paramedics. Some information comparing their physical profiles is shown in Table Table 30.33.
Compare the mean number of push-ups completed in one minute for the two groups of paramedics. (The standard error for the difference between the means is \(4.0689\text{.}\))
[Dataset: Anorexia] Young girls (\(n = 29\)) with anorexia received cognitive behavioural treatment ([113]), while another \(n = 26\) young girls received a control treatment (the ’standard’ treatment). All girls had their weight recorded before and after treatment.
Researchers studied the impact of a gluten-free diet on dental cavities [342]. Some summary information regarding the number decayed, missing and filled teeth (DMFT) is shown in Table Table 30.34. An exact\(95\)% CI is given as for the difference is \(-2.32\) to \(2.76\text{.}\)
[Dataset: ReactionTime] [335] examined the reaction times, while driving, for students from the University of Utah [318]. In one study, students were randomly allocated to one of two groups: one group used a mobile phone while driving in a driving simulator, and one group did not use a mobile phone while driving in a driving simulator. The reaction time for each student was measured.
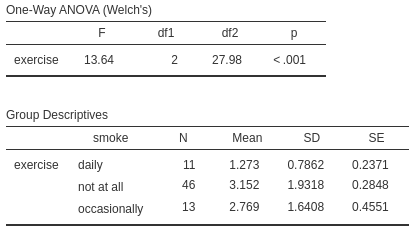
[Dataset: BMI] [270] collected data from hospital outpatients at an Irish hospital. One RQ in the study concerns comparing the mean number of days per week that patients exercise for more than \(30\) minutes (say, \(\mu\)) according to their smoking status: daily (\(D\)), occasionally (\(O\)) or not at all (\(N\)).