So far, you have learnt to ask an RQ, design a study, describe and summarise the data, and understand propbability. In this chapter, you will learn to:
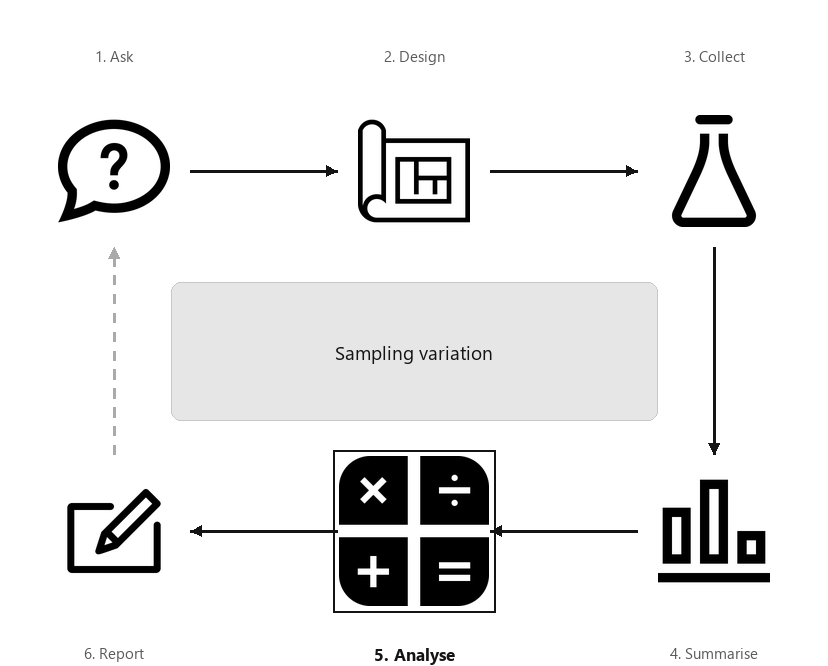
A diagram showing the six steps of research, arranged in a cycle: Ask, Design, Collect, Classify and summarise, Analyse, Report. Step 5 (Analyse) is highlighted, captioned “Sampling variation”.
One of the most important ideas in research and statistics is that the sample being studied is only one of countless possible samples that could have been selected to study.
In research, decisions need to be made about populations based on samples; that is, about parameters based on statistics. The challenge is that the decision must be made using only one of the many possible samples, and every sample is likely to be different. Each sample will produce a different value for the statistic. This is called sampling variation.
Section19.2Sample proportions have a sampling distribution
Sample proportions, like all statistics, vary from sample to sample; that is, sampling variation exists, so sample proportions have a sampling distribution.
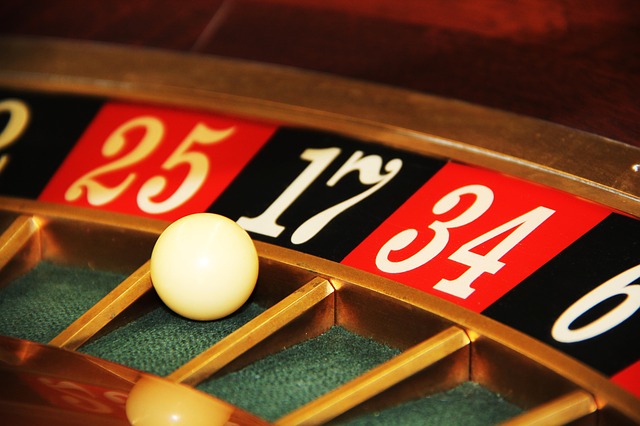
Consider a European roulette wheel: a ball and wheel are spun, and the ball can land on any number on the wheel from \(0\) to \(36\) (inclusive). Using the classical approach to probability, the probability of the ball landing on an odd number (an ’odd-spin’) is \(p = 18/37 = 0.486\text{.}\) This is the population proportion (the parameter).
If the wheel is spun (say) \(15\) times, the sample proportion of odd-spins, denoted \(\hat{p}\text{,}\) will vary. But, how does \(\hat{p}\) vary from one set of \(15\) spins to another set of \(15\) spins? Can we describe how the values of \(\hat{p}\) vary across the possible samples?
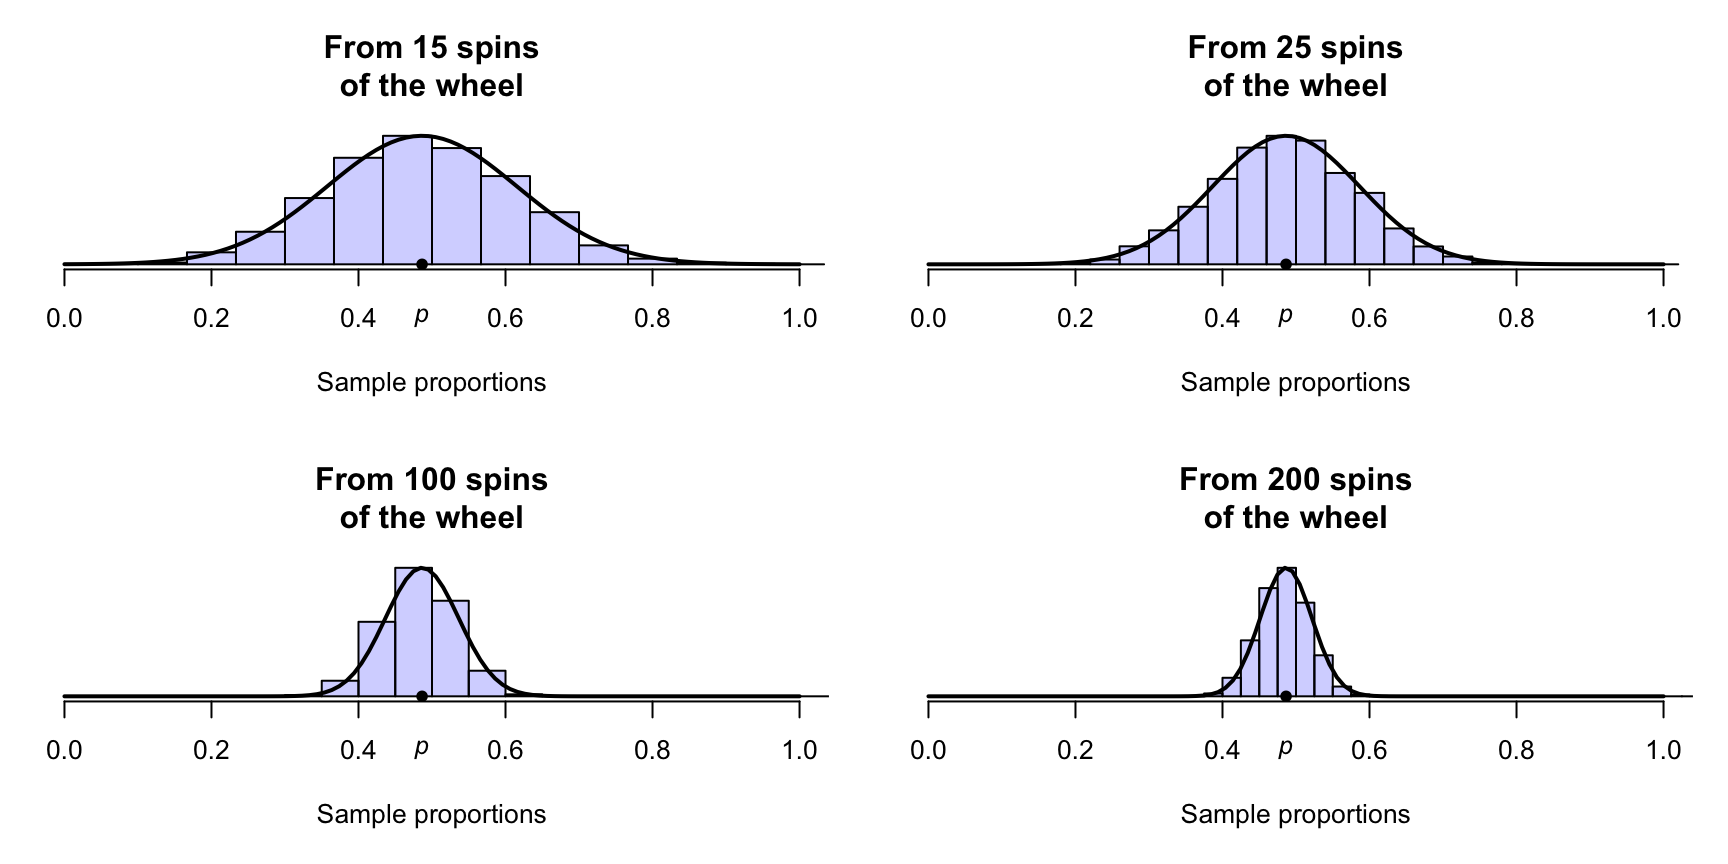
Computer simulation can be used to demonstrate what happens if the wheel was spun, over and over again, for \(n = 15\) spins each time, and the proportion of odd-spins was recorded for each repetition. The proportion of odd spins \(\hat{p}\) varies from sample to sample (sampling variation), as shown by the histogram (Fig. Figure 19.4, top left panel). The shape of the distribution is approximately bell shaped. We can see that, for many repetitions of \(15\) spins, \(\hat{p}\) is rarely smaller than \(0.2\text{,}\) and rarely larger than \(0.8\text{.}\) That is, reasonable values to expect for \(\hat{p}\) are between about \(0.2\) and \(0.8\text{.}\)
If the wheel was spun (say) \(n = 25\) times (rather than \(15\) times), \(\hat{p}\) again varies (Fig. Figure 19.4, top right panel): the values of \(\hat{p}\) vary from sample to sample. The same process can be repeated for many repetitions of (say) \(n = 100\) and \(n = 200\) spins (Fig. Figure 19.4, bottom panels).
Notice that as the sample size \(n\) increases, the variation in the sampling distribution gets smaller. With \(200\) spins, for instance, observing a sample proportion smaller than \(0.4\) or greater than \(0.6\) seems highly unusual, but these are not uncommon at all for \(15\) spins.
Example19.5.Reasonable values for the sample proportion.
Suppose a roulette wheel was spun \(100\) times, and \(31\) odd numbers were observed. The sample proportion is \(\hat{p} = 31/100 = 0.31\text{.}\) From Fig. Figure 19.4 (bottom left panel), a sample proportion this low almost never occurs in a sample of \(100\) rolls.
This is very unlikely to occur from a fair roulette wheel. Hence, we either observed something highly unusual, or the wheel is not fair (e.g., a problem exists with the wheel).
The values of the sample proportion vary from sample to sample. The distribution of the possible values of the sample proportion is called a sampling distribution.
Under certain conditions, the sampling distribution of a sample proportion is described by an approximate bell-shaped distribution (formally called a normal distribution). In general, the approximation gets better as the sample size increases. In addition, the possible values of \(\hat{p}\) vary less as the sample size increases.
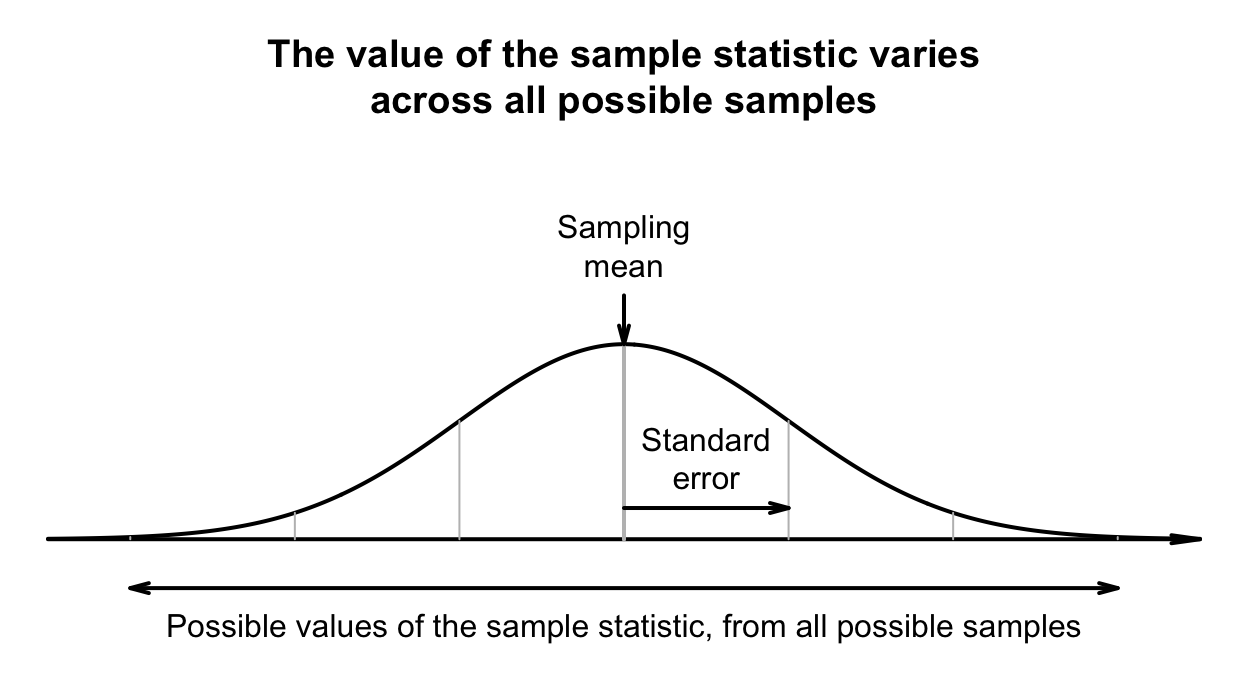
The mean of the sampling distribution is called the sampling mean; the standard deviation of the sampling distribution is called the standard error (Fig. Figure 19.12).
Consider a European roulette wheel again (Sect. Section 19.2). Rather than recording the sample proportion of odd-spins, suppose the sample mean of the numbers was recorded. If the wheel is spun (say) \(15\) times, the sample mean of the spins \(\bar{x}\) will vary from one set of \(15\) spins to another. But how does it vary?
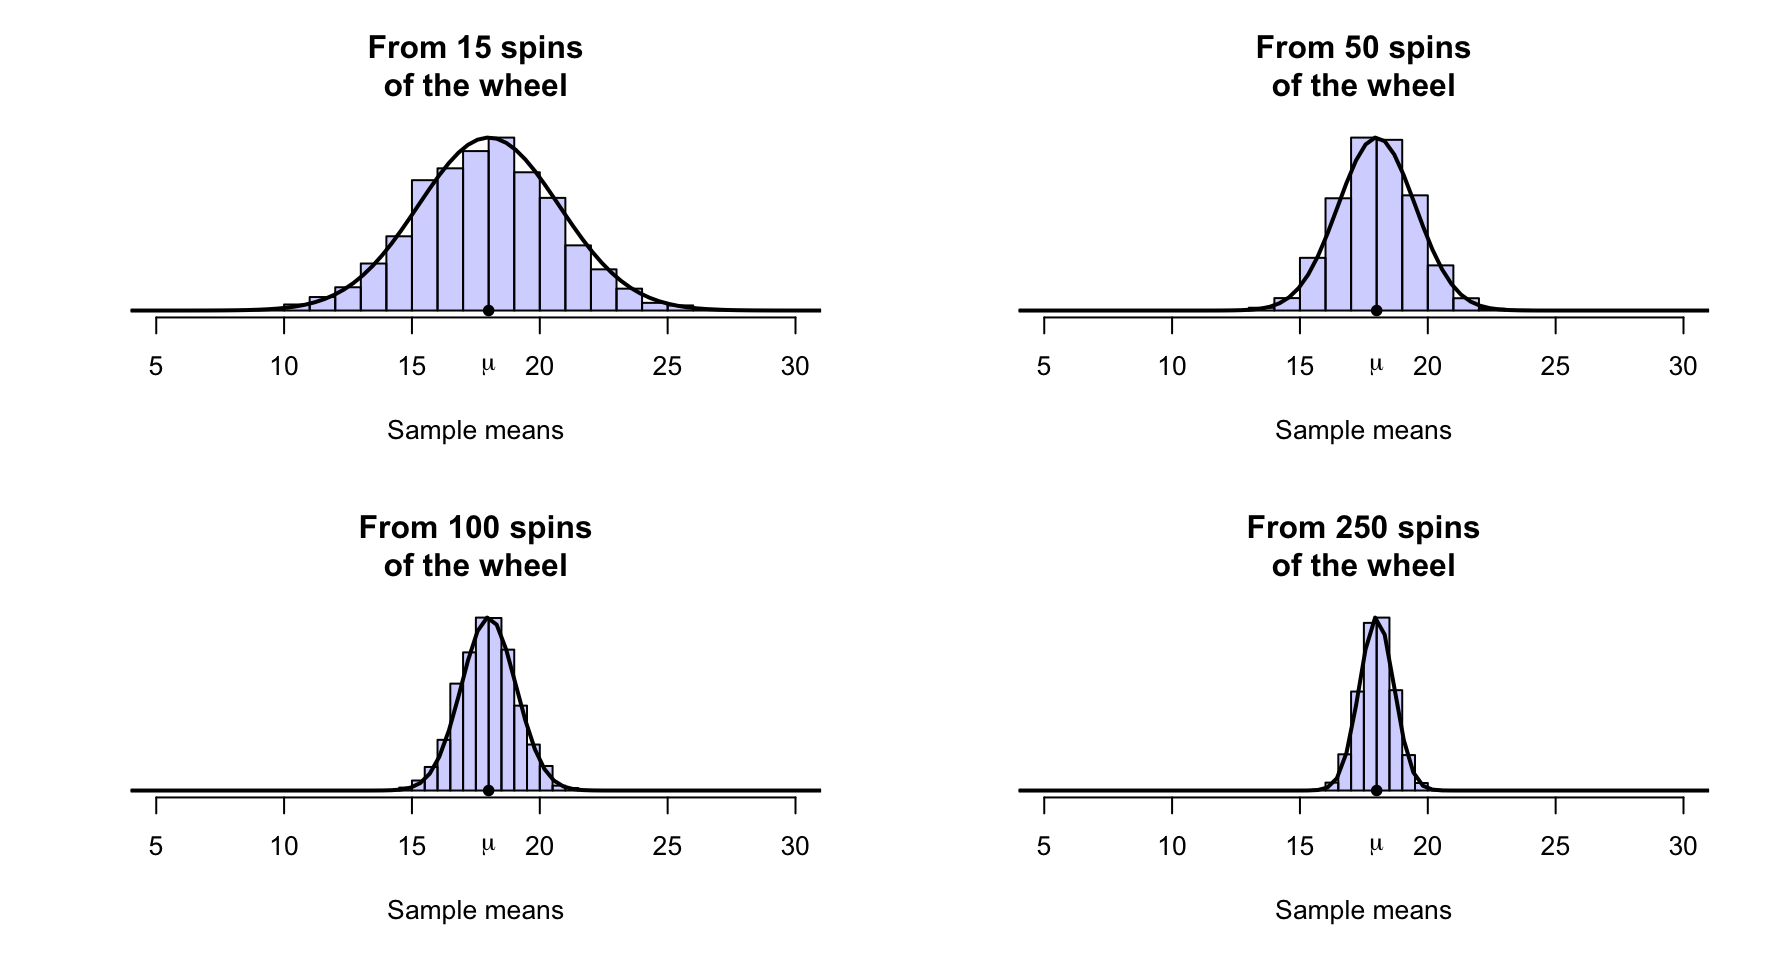
Again, computer simulation can be used to demonstrate what could happen if the wheel was spun \(15\) times, over and over again, and the mean of the numbers was recorded for each repetition. Clearly, the sample mean spin \(\bar{x}\) can vary from sample to sample (sampling variation) for \(n = 15\) spins (Fig. Figure 19.7, top left panel).
When \(n = 15\text{,}\) the sample mean \(\bar{x}\) varies from sample to sample, and the shape of the distribution again is approximately bell-shaped. If the wheel was spun more than \(15\) times (say, \(n = 50\) times) something similar occurs (Fig. Figure 19.7, top right panel): the values of \(\bar{x}\) vary from sample to sample, and the values have an approximate bell-shaped (normal) distribution. In fact, the values of \(\bar{x}\) have a bell-shaped distribution for other numbers of spins also (Fig. Figure 19.7, bottom panels).
The values of the sample mean vary from sample to sample. The distribution of the possible values of the sample mean is called a sampling distribution.
Under certain conditions, the sampling distribution of a sample mean is described by an approximate bell-shaped (or normal) distribution. In general, the approximation gets better as the sample size increases. In addition, the possible values of \(\bar{x}\) vary less as the sample size increases.
The mean of the sampling distribution is called the sampling mean; the standard deviation of the sampling distribution is called the standard error (Fig. Figure 19.12).
Example19.9.Reasonable values for the sample mean.
Suppose we spun a roulette wheel \(100\) times, and the mean of the observed numbers was \(\bar{x} = 18.9\text{.}\) From Fig. Figure 19.7 (bottom left panel), a sample mean with this value does not look unusual at all; it would occur reasonably frequently. The evidence does not suggest a problem with the wheel.
As we have seen, each sample is likely to be different, so any statistic is likely to vary from sample to sample. (The value of the population parameter does not change.) This variation in the possible values of the observed sampling statistic is called sampling variation.
As seen in the previous two sections, the value of a sample statistic varies from sample to sample. The value of the sample statistic that is observed depends on which one of the countless samples happens to be observed
The possible values of the statistic that we could potentially observe have a distribution (specifically, a sampling distribution); see Fig. Figure 19.12. The mean of this sampling distribution is called the sampling mean. The sampling mean is the average value of all possible values of the statistic. Not all sampling distributions have a bell-shaped distribution.
The standard deviation of this sampling distribution is called the standard error. The standard error measures how the value of the statistic varies across all possible values of the statistic; see Fig. Figure 19.12. The standard error is a measure of how precisely the sample statistic estimates the population parameter. If every possible sample (of a given size) was found, and the statistic computed from each sample, the standard deviation of all these estimates is the standard error.
A standard error is the standard deviation of the sampling distribution of a statistic: the standard deviation of the values of the statistic from all possible samples.
Figure19.12.Describing how the value of the sample statistic varies across all possible samples, when the sampling distribution has a normal distribution.
Figures Figure 19.4 and Figure 19.7 show that the variation in the values of the statistic get smaller for larger sample sizes. That is, the standard error gets smaller as the sample sizes get larger: sample statistics show less variation for larger \(n\text{.}\) This makes sense: larger samples generally produce more precise estimates. After all, that’s the advantage of larger samples: all else being equal, larger samples produce more precise estimates (Sect. Section 6.3).
In Fig. Figure 19.7, a sample of \(250\) (i.e., \(250\) spins) is unlikely to produce a sample mean larger than \(20\text{,}\) or smaller than \(15\text{.}\) However, in a sample of size \(15\) (i.e., \(15\) spins) sample means near \(15\) and \(20\) are quite commonplace.
In samples of size \(100\text{,}\) the variation in the mean spin is smaller than in samples of size \(15\text{.}\) Hence, the standard error (the standard deviation of the sampling distributions) will be smaller for samples of size \(250\) than for samples of size \(15\text{.}\)
For many sample statistics, the variation from sample to sample can be approximately described by a bell-shaped (normal) distribution (the sampling distribution) if certain conditions are met. Furthermore, the standard deviation of this sampling distribution is called the standard error. The standard error is a special name given to the standard deviation that describes the variation in the possible values of a statistic.
Even experienced researchers confuse the meaning and the usage of the terms standard deviation and standard error[169]. Understanding the difference is important.
The standard deviation, in general, quantifies the amount of variation in any quantity that varies. The standard error only ever refers to the standard deviation that describes a sampling distribution.
Typically, in a research study, standard deviations describe the variation in the individuals in a sample: how observations vary from individual to individual. The standard error is only used to describe how sample estimates vary from sample to sample (i.e., to describe the precision of sample estimates).
The standard error is a standard deviation, but specifically describes the variation in sampling distributions. Any numerical quantity estimated from a sample (a statistic) can vary from sample to sample, and so has sampling variation, a sampling distribution, and hence a standard error. (Not all sampling distributions are normal distributions, however.)
The standard error is often abbreviated to ’SE’ or ’s.e.’. For example, the ’standard error of the sample mean’ is usually written \(s.e.(\bar{x})\text{,}\) and the ’standard error of the sample proportion’ is usually written \(s.e.(\hat{p})\text{.}\)
A sampling distribution describes how all possible values of a statistic vary from sample to sample. Under certain circumstances, the sampling distribution often can be described by a bell-shaped (or normal) distribution. The standard deviation of this normal distribution is called a standard error. The standard error is the name specifically given to the standard deviation that describes the variation in the statistic across all possible samples.
Researchers are studying the spending habits of customers. They would like to measure the variation in the amount spent by shoppers per transaction at a supermarket.
Researchers are studying the time it takes for inner-city office workers to travel to work each morning. They would like to determine the precision with which their estimate (a mean of \(47\) mins) has been measured.
A study examined the effect of taking a pain-relieving drug on children. The researchers want to describe the sample they used in the study, including a description of how the ages of the children in the study vary.
A study estimated the proportion of children aged under \(14\) who owned a mobile (cell) phone. The researchers want to report this estimate, indicating the precision of that estimate.
Suppose the wheel was spun \(15\) times (Fig. Figure 19.7, top left panel), and the mean spin was \(22.1\text{.}\) What would you conclude about the wheel?
Suppose the wheel was spun \(250\) times (Fig. Figure 19.7, bottom right panel), and the mean spin was \(22.1\text{.}\) What would you conclude about the wheel?
Suppose the wheel was spun \(50\) times (Fig. Figure 19.7, top right panel), and the mean spin was \(22.1\text{.}\) What would you conclude about the wheel?
Suppose the wheel was spun \(50\) times (Fig. Figure 19.7, top right panel), and the mean spin was \(24.0\text{.}\) What would you conclude about the wheel?
Suppose the wheel was spun \(15\) times (Fig. Figure 19.4, top left panel), and the proportion of spins showing an odd number was \(0.44\text{.}\) What would you conclude about the wheel?
Suppose the wheel was spun \(15\) times (Fig. Figure 19.4, top left panel), and the proportion of spins showing an odd number was \(0.13\text{.}\) What would you conclude about the wheel?
Suppose the wheel was spun \(15\) times (Fig. Figure 19.4, top left panel), and the proportion of spins showing an odd number was \(0.65\text{.}\) What would you conclude about the wheel?
Suppose the wheel was spun \(200\) times (Fig. Figure 19.4, bottom right panel), and the proportion of spins showing an odd number was \(0.65\text{.}\) What would you conclude about the wheel?
What is wrong with using the standard error of the mean to describe the sample? How would you explain the difference between the standard error and the standard deviation?