So far, you have learnt to ask an RQ, design a study, classify and summarise the data, and construct a confidence interval for one proportion. You have also been introduced to confidence intervals. In this chapter, you will learn to
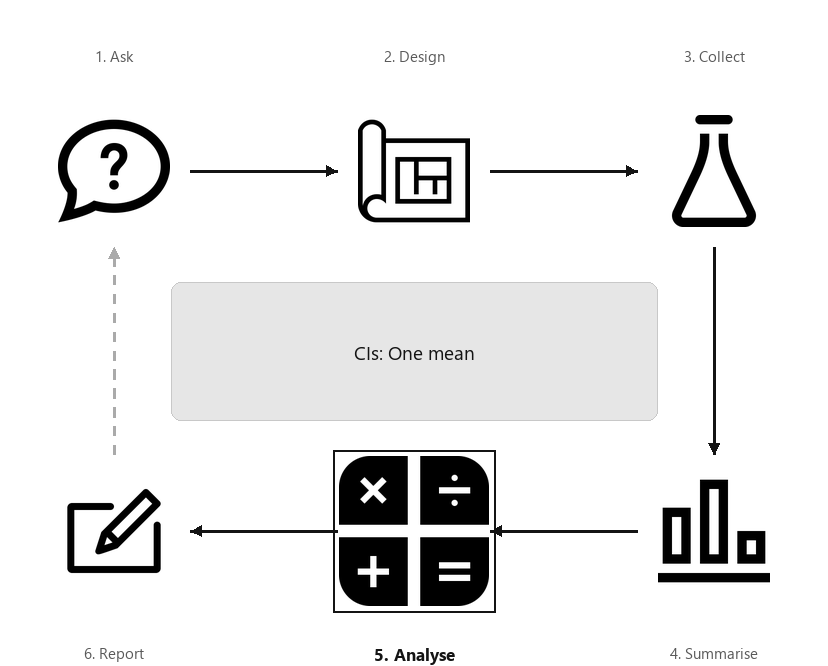
A diagram showing the six steps of research, arranged in a cycle: Ask, Design, Collect, Classify and summarise, Analyse, Report. Step 5 (Analyse) is highlighted, captioned “CIs: One mean”.
Consider rolling a fair, six-sided die \(n = 25\) times. Suppose we are interested in the mean of the numbers that are rolled. Since every face of the die is equally likely to appear on any one roll, the population mean of all possible rolls is \(\mu = 3.5\) (in the middle of the numbers on the faces of the die, so this is also the median).
Since many values for the sample mean are possible, the values of the sample mean vary (called sampling variation) and have a distribution (called a sampling distribution).
Section23.2Sampling distribution for \(\bar{x}\text{:}\) for \(\sigma\) known
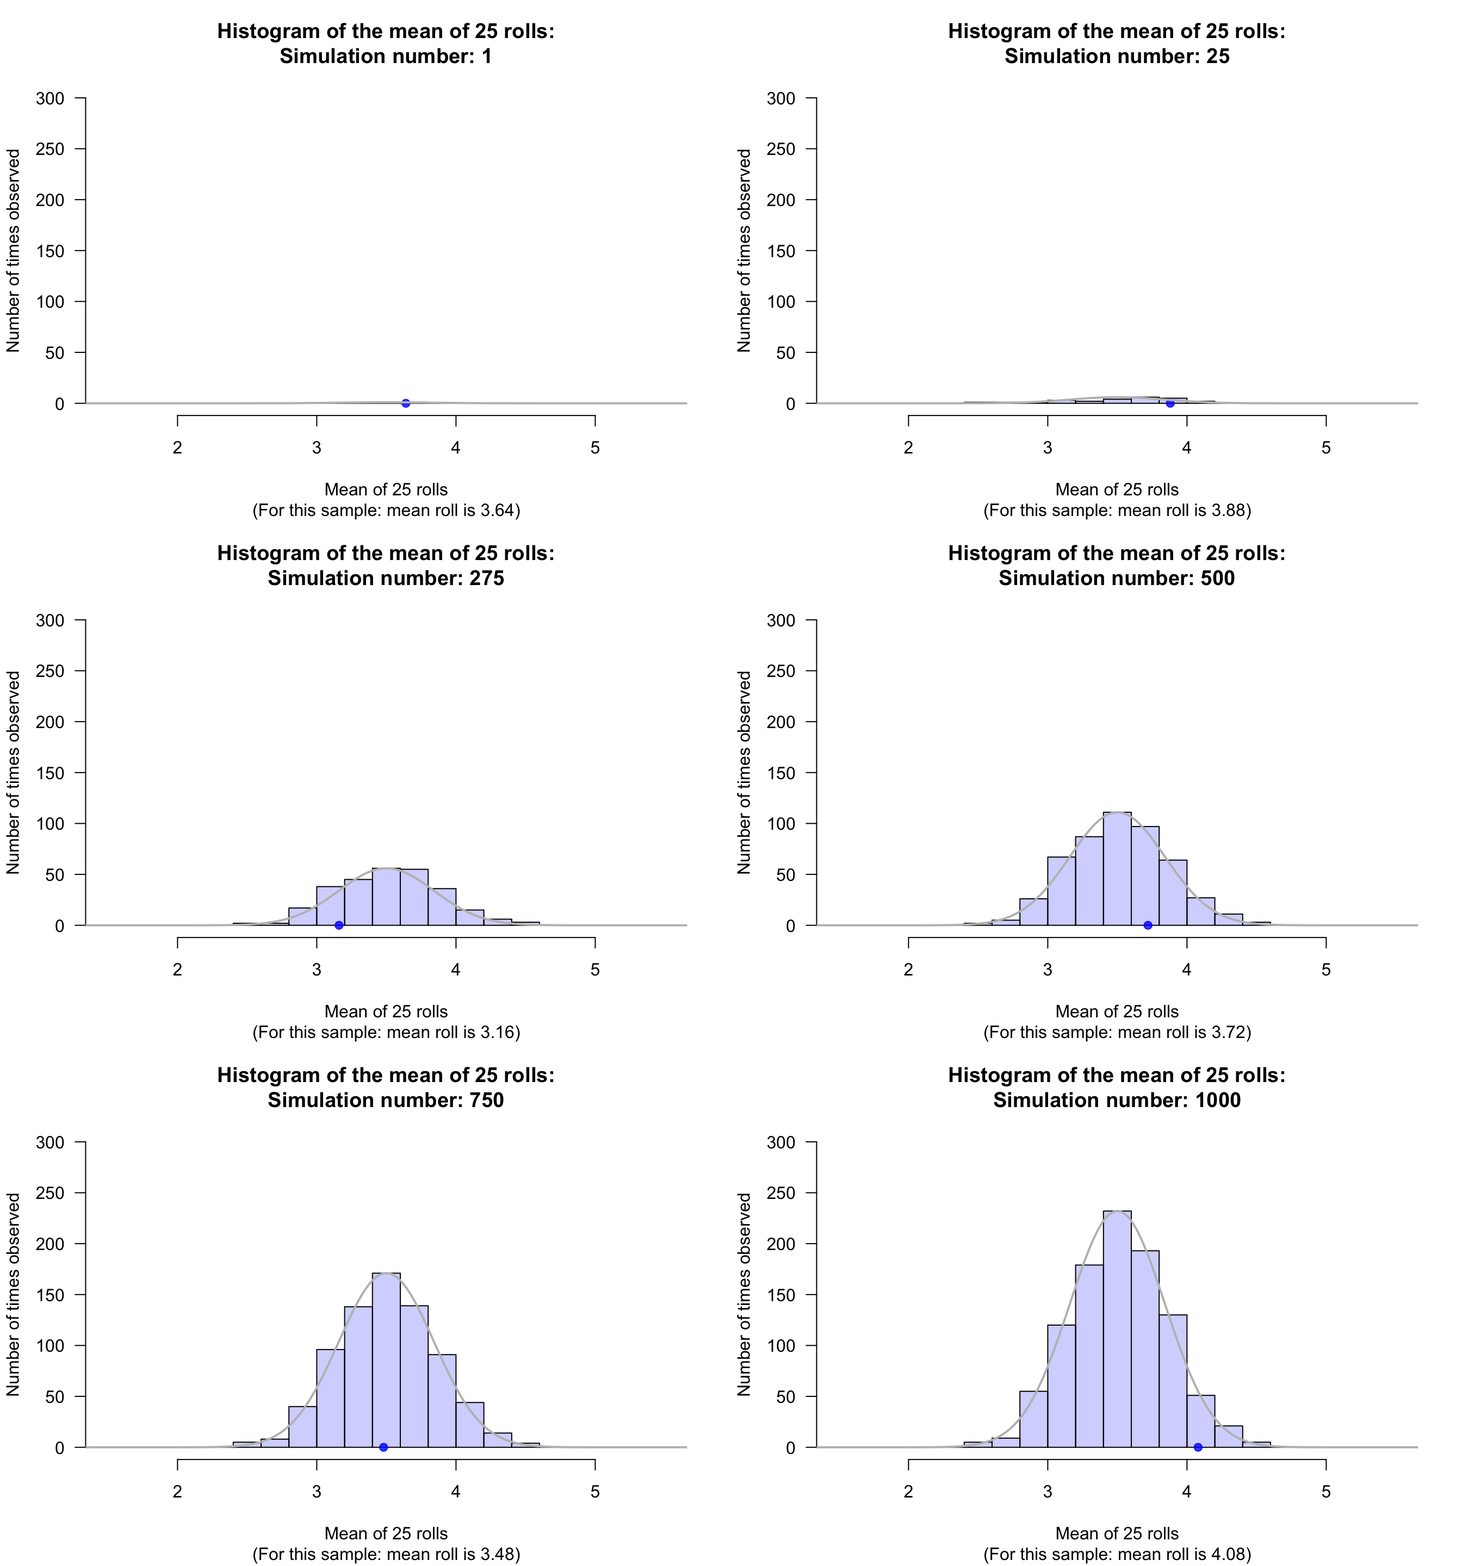
Suppose thousands of people made one set of \(25\) rolls each, and computed the mean for their sample. Then, every person would have a sample mean for their sample, and we could produce a histogram of all these sample means (Fig. Figure 23.2). The mean for any single sample of \(n = 25\) rolls will sometimes be higher than \(\mu = 3.5\text{,}\) and sometimes lower than \(\mu = 3.5\text{,}\) but often close to \(3.5\text{.}\) Sample means larger than \(4.5\text{,}\) or smaller than \(2.5\text{,}\) would occur rarely.
Figure23.2.Rolling dice: the mean of 25 rolls, for thousands of repetitions. The solid line is the normal distribution used to model the sampling distribution.
From Fig. Figure 23.2, the sample means vary with an approximate normal distribution (as with the sample proportions). This normal distribution does not describe the data; it describes how the values of the sample means vary across all possible samples. Under certain conditions (Sect. Section 23.5), the values of the sample mean vary with a normal distribution, and this normal distribution has a mean and a standard deviation.
The mean of this sampling distribution (the sampling mean) has the value \(\mu\text{.}\) The standard deviation of this sampling distribution (the standard error of the sample means) is denoted \(\text{s.e.}(\bar{x})\text{.}\) When the population standard deviation \(\sigma\) is known, the value of the standard error happens to be
However, since the population standard deviation is rarely ever known, we will focus on the case where the value of \(\sigma\) is unknown (and estimated by the sample standard deviation, \(s\)).
Section23.3Sampling distribution for \(\bar{x}\text{:}\) for \(\sigma\) unknown
Since the value of the population standard deviation \(\sigma\) is almost never known, the sample standard deviation \(s\) is used to estimate the standard error of the mean: \(\text{s.e.}(\bar{x}) = s/\sqrt{n}\text{.}\) With this information, the sampling distribution of the sample mean can be described.
Definition23.3.Sampling distribution of a sample mean for \(\sigma\) unknown.
When the population standard deviation is unknown, the sampling distribution of the sample mean is (when certain conditions are met; Sect. Section 23.5) described by:
A mean or a median may be appropriate for describing the data. However, the sampling distribution for the sample mean (under certain conditions) has a normal distribution. Hence, the mean is appropriate for describing the sampling distribution, even if not for describing the data.
In practice, we do not know the value of \(\mu\text{.}\) After all, that’s why we take a sample: to estimate the value of the unknown population mean. Suppose, then, we did not know the value of \(\mu\) (the parameter) for the die-rolling situation, but we have an estimate: the value of \(\bar{x}\text{,}\) the sample mean (the statistic). The value of \(\bar{x}\) may be a bit smaller than \(\mu\text{,}\) or a bit larger than \(\mu\) (but we don’t know which, since we do not know the value of \(\mu\)). In other words, the values of \(\mu\) that may have produced the observed value \(\bar{x}\) may be less than the value of \(\bar{x}\text{,}\) or greater than the value of \(\bar{x}\text{.}\)
Since the values of \(\bar{x}\) vary from sample to sample (sampling variation) with an approximate normal distribution (Def. Definition 23.3), the \(68\)–\(95\)–\(99.7\) rule could be used to construct an approximate \(95\)% interval for the plausible values of \(\mu\) that may have produced the observed values of the sample mean. This is a confidence interval (or a CI).
\begin{equation*}
\bar{x} \pm \overbrace{\big(\text{multiplier}\times\text{s.e.}(\bar{x})\big)}^{\text{The `margin of error'}}.
\end{equation*}
For an approximate \(95\)% CI, the multiplier is about \(2\) (since about \(95\)% of values are within two standard deviations of the mean, from the \(68\)–\(95\)–\(99.7\) rule).
where \(\big( \text{multiplier} \times \text{s.e.}(\bar{x})\big)\) is the margin of error, and \(\text{s.e.}(\bar{x})\) is the standard error of \(\bar{x}\) (see Equation (23.1)), where \(\bar{x}\) is the sample mean, and \(n\) is the sample size. For an approximate\(95\)% CI, the multiplier is \(2\text{.}\)
CIs are often \(95\)% CIs, but any level of confidence can be used (with the appropriate multiplier). In this book, a multiplier of \(2\) is used when approximate\(95\)% CIs are created manually, and otherwise software is used. Commonly, CIs are computed at \(90\)%, \(95\)% and \(99\)% confidence levels.
However, when computing the CI for a sample mean, the multiplier is not a \(z\)-score. The multiplier would be a \(z\)-score if the value of the population standard deviation was known (e.g., the situation in Sect. Section 23.2). When \(\sigma\) is unknown (almost always), and the sample standard deviation is used instead, the multiplier is a \(t\)-score (Sect. Section 27.4).
The values of \(t\)- and \(z\)-multipliers are very similar, and (except for small sample sizes) using an approximate multiplier of \(2\) is reasonable for computing approximate\(95\)% CIs in either case.
Pretend for the moment that the value of \(\mu\) was unknown, and we tossed a die \(25\) times, and found \(\bar{x} = 3.2\) and \(s = 2.5\text{.}\) Then,
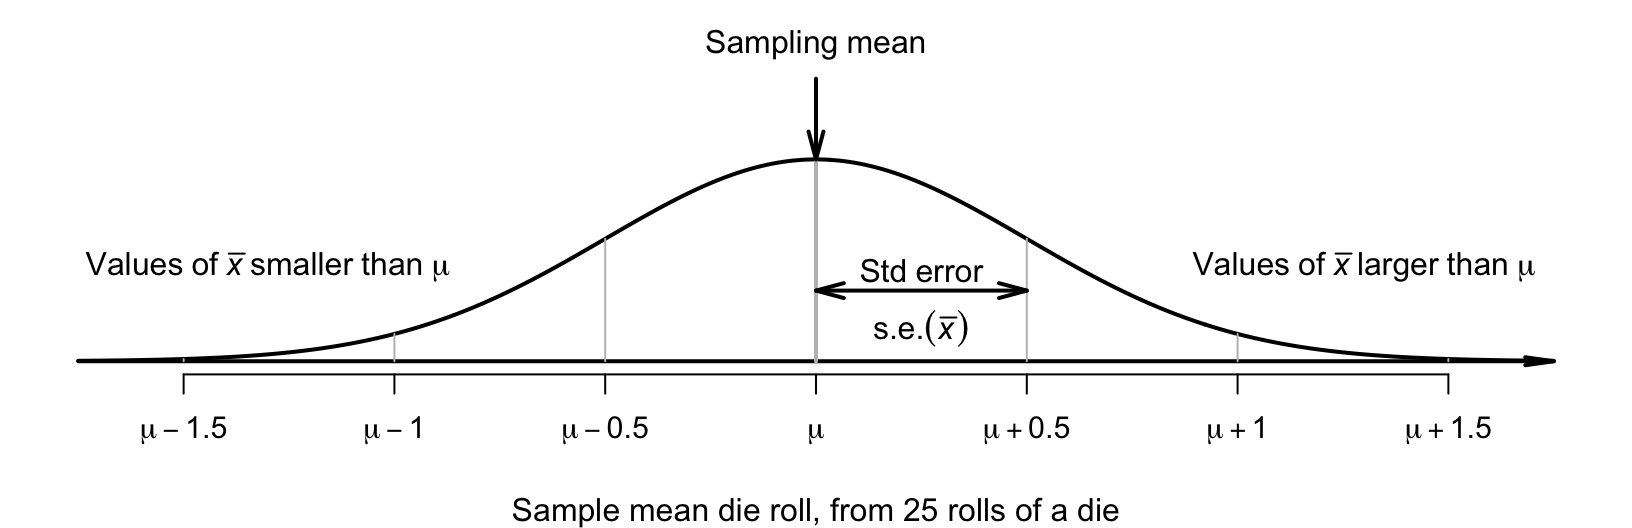
Hence, the sample means vary with an approximate normal distribution, centred around the unknown value of \(\mu\text{,}\) with a standard deviation of \(\text{s.e.}(\bar{x}) = 0.5\) (Fig. Figure 23.7).
Figure23.7.The sampling distribution is an approximate normal distribution with mean \(3.5\) and standard error \(0.5\text{;}\) it is a model of how the mean roll varies when a die is rolled \(25\) times.
Our estimate of \(\bar{x} = 3.2\) may be a bit smaller than the value of \(\mu\text{,}\) or a bit larger than the value of \(\mu\text{;}\) that is, the value of \(\mu\) is \(\bar{x}\text{,}\) give-or-take a bit. A range of \(\mu\) values that are likely to straddle \(\bar{x}\) is given by a CI. An approximate\(95\)% CI is (using Equation (23.2)) from
Hence, values of \(\mu\) between \(2.2\) to \(4.2\) could reasonably have produced a sample mean of \(\bar{x} = 3.2\text{.}\) Using software, the exact \(95\)% CI is from \(2.17\) to \(4.23\text{,}\) the same as the approximate CI to one decimal place.
As with any CI, the underlying mathematics requires certain conditions to be met so that the results are statistically valid (i.e., the sampling distribution is sufficiently like a normal distribution).
This condition ensures that the sampling distribution of the sample means has an approximate normal distribution (so that, for example, the \(68\)–\(95\)–\(99.7\) rule can be used). Provided the sample size is larger than about \(25\text{,}\) this will be approximately true even if the distribution of the individuals in the population do not have a normal distribution. That is, when \(n \ge 25\) the sample means generally have an approximate normal distribution, even if the data themselves do not follow a normal distribution. The units of analysis are also assumed to be independent (e.g., ideally from a simple random sample).
When \(n \ge 25\) approximately, the data do not have to have a normal distribution. The sample means need to have a normal distribution, which is approximately true if the statistical validity conditions are true.
The second statistical validity condition requires the population to have a normal distribution. Knowing this is obviously difficult; we do not have access to the whole population. All we can reasonably do is to identify (from the sample) whether the population is likely to be non-normal (when the CI would be not valid).
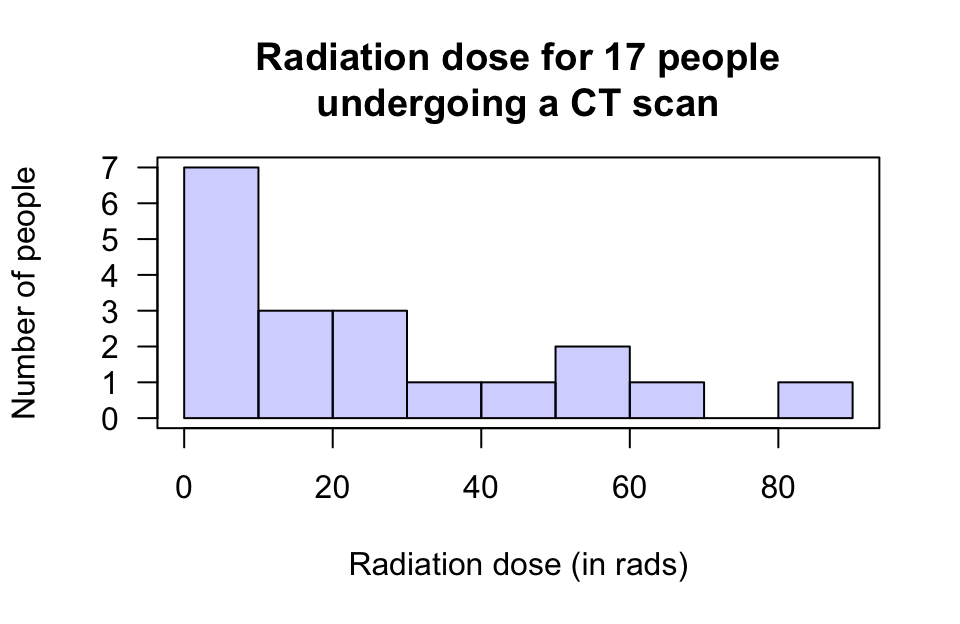
[334] examine exposure to radiation for CT scans in the abdomen for \(n = 17\) patients [339]. As the sample size is ’small’ (less than \(25\)), the population data must have a normal distribution for a CI for \(\mu\) to be statistically valid.
A histogram of the total radiation dose received using the sample data (Fig. Figure 23.11) suggests this is very unlikely. Even though the histogram is from sample data, it seems improbable that the data in the sample would have come from a population with a normal distribution.
A CI for the mean of these data will probably not be statistically valid. Other methods (such as resampling methods, which are beyond the scope of this book) are needed to compute a CI for the mean.
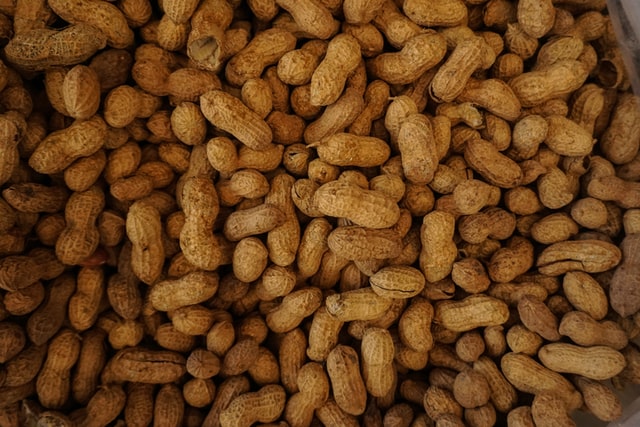
[89] studied peanuts gathered from a variety of regions in the United States over various times (perhaps a representative sample). They found the sample mean cadmium concentration was \(\bar{x} = 0.076\ppms\) with a standard deviation of \(s = 0.0460\ppms\text{,}\) from a sample of \(290\) peanuts. The parameter is \(\mu\text{,}\) the population mean cadmium concentration in peanuts.
Every sample of \(n = 290\) peanuts is likely to produce a different sample mean, so sampling variation in \(\bar{x}\) exists and can be measured using the standard error:
The approximate \(95\)% CI is \(0.0768 \pm (2 \times 0.002701)\text{,}\) or \(0.0768 \pm 0.00540\text{,}\) which is from \(0.0714\) to \(0.0822\ppms\text{.}\) (The margin of error is \(0.00540\text{.}\)) We write:
The sample mean cadmium concentration of peanuts is \(0.0768\ppms\) (\(n = 290\)), with an approximate \(95\)% CI from \(0.0714\) to \(0.0822\ppms\text{.}\)
If we repeatedly took samples of size \(290\) from this population, about \(95\)% of the \(95\)% CIs would contain the population mean (our CI may or may not contain the value of \(\mu\)). The plausible values of \(\mu\) that could have produced \(\bar{x} = 0.0768\) are between \(0.0714\) and \(0.0822\ppms\text{.}\) Alternatively, we are about \(95\)% confident that the CI of \(0.0714\) to \(0.0822\ppms\) straddles the population mean.
To compute a confidence interval (CI) for a mean, compute the sample mean, \(\bar{x}\text{,}\) and identify the sample size \(n\text{.}\) Then compute the standard error, which quantifies how much the value of \(\bar{x}\) varies across all possible samples:
where \(s\) is the sample standard deviation. The margin of error is (multiplier\({}\times{}\)standard error), where the multiplier is \(2\) for an approximate \(95\)% CI (from the \(68\)–\(95\)–\(99.7\) rule). Then the CI is:
[319] studied American black bears, and found the mean weight of the \(n = 185\) male bears was \(\bar{x} = 84.9\kgs\text{,}\) with a standard deviation of \(s = 51.1\kgs\text{.}\)
[327] studied the weight of the school bags of a sample of \(586\) children in Grades \(6\)--\(8\) in Tabriz, Iran. The mean weight was \(\bar{x} = 2.8\kgs\) with a standard deviation of \(s = 0.94\kgs\text{.}\)
[Dataset: LungCap] [26] studied the lung capacity of children in East Boston. They measured the forced expiratory volume (FEV) of a sample of \(n = 45\) eleven-year-old girls. For these children, the mean lung capacity was \(\bar{x} = 2.85\) litres and the standard deviation was \(s = 0.43\) litres [1]. Find an approximate \(95\)% CI for the population mean lung capacity of eleven-year-old females from East Boston.
[337] studied lead smelter emissions near children’s public playgrounds. They found the mean lead concentration at one playground (Memorial Park, Port Pirie, in South Australia) was \(6\,956.41\microgs.\ms^{-2}\text{,}\) with a standard deviation of \(7\,571.74\microgs.\ms^{-2}\text{,}\) from a sample of \(n = 58\) wipes taken over a seven-day period. (As a reference, the Western Australian Government recommends a maximum of \(400\microgs.\ms^{-2}\text{.}\))
Find an approximate \(95\)% CI for the mean lead concentration at this playground. Would these results apply to playgrounds in other parts of Australia?
[332] studied the brushing time for \(60\) young adults (aged \(18\)--\(22\) years old), and found the mean tooth brushing time was \(33.0\secs\text{,}\) with a standard deviation of \(12.0\secs\text{.}\) Find an approximate \(95\)% CI for the mean brushing time for young adults.
[236] asked paramedics (\(n = 199\)) to estimate the amount of blood loss on four different surfaces. When the actual amount of blood spill on concrete was \(1\,000\mLs\text{,}\) the mean guess was \(846.4\mLs\) (with a standard deviation of \(651.1\mLs\)).
[Dataset: NHANES] Using data from the nhanes study [160], the approximate \(95\)% CI for the mean direct HDL cholesterol is \(1.356\) to \(1.374\mmols\)/L. Which (if any) of these interpretations are acceptable? Explain why the other interpretations are incorrect.
[328] describe the diameter of Quercus bicolor trees planted in a lawn as having a mean of \(25.8\cms\text{,}\) with a standard error of \(0.64\cms\text{,}\) from a sample of \(19\) trees. Which (if either) of the following is correct?
About \(95\)% of the trees in the sample will have a diameter between \(25.8 - (2\times 0.64)\) and \(25.8 + (2\times 0.64)\cms\) (using the \(68\)–\(95\)–\(99.7\) rule).
About \(95\)% of these types of trees in the population will have a diameter between \(25.8 - (2\times 0.64)\) and \(25.8 + (2\times 0.64)\cms\) (using the \(68\)–\(95\)–\(99.7\) rule)?
[357] studied \(n = 30\) five-year-old children, and found the mean time for the children to eat a cookie was \(61.3\secs\text{,}\) with a standard deviation of \(29.4\secs\text{.}\)
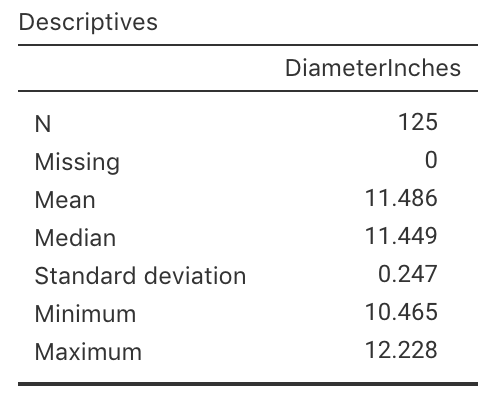
[Dataset: PizzaSize] In 2011, Eagle Boys Pizza ran a campaign that claimed (among many other claims) that Eagle Boys pizzas were ’Real size \(12\)-inch large pizzas’ in an effort to out-market Dominos Pizza. Eagle Boys made the data behind the campaign publicly available [291]. A summary of the diameters of a sample of \(125\) of Eagle Boys large pizzas is shown in Fig. Figure 23.12.
They purchased a carton containing \(n = 25\) boxes of matches, and Jake counted the number of matches in one of those \(25\) boxes. The box contained \(44\) matches.
Then, they counted the number of matches in each of the \(n = 25\) boxes, and found the mean number of matches per box was \(44.9\) matches, and the standard deviation was \(0.124\text{.}\) Jake notes that the mean is \(44.9\) matches per box, and says: ’You can’t have \(0.9\) of a match. That’s dumb.’ How would you respond?
’Wow!’ said Jake. ’The claim is \(45\) matches per box on average, but the mean really is \(44.9\text{!}\) They’re liars!’ What is Jake’s misunderstanding?
’Come on, Jake,’ said Claire. ’As if the mean will be exactly\(45\) in a sample every single time. Let’s work out the confidence interval.’ Why does Claire think a CI is needed? What will it tell them?
’Aha,’ said Jake; ’I told you so! They are absolutely lying! Your confidence interval doesn’t even include their mean of \(45\text{!}\) The manufacturer must be lying!’ Is Jake correct? Why or why not? What does the CI mean?