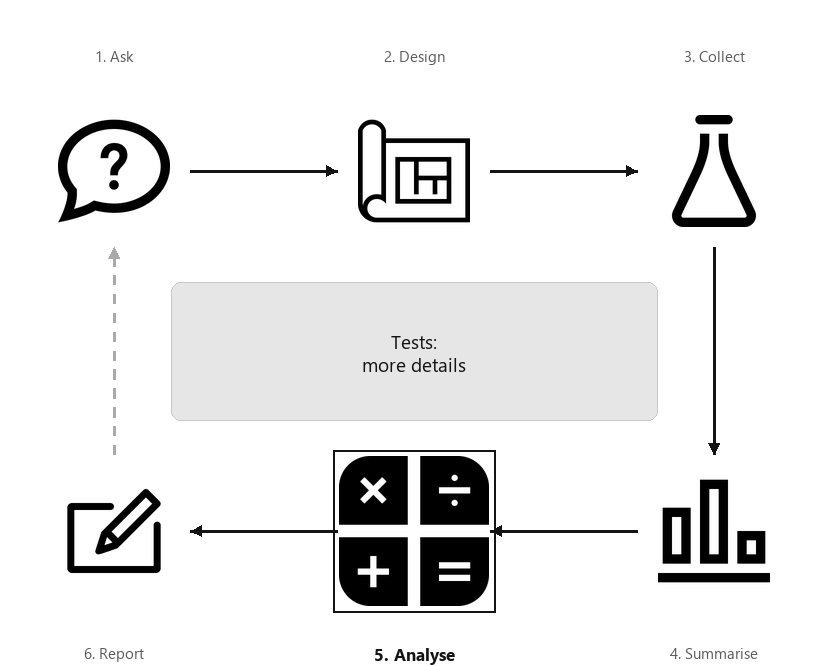
You have learnt to ask an RQ, design a study, classify and summarise the data, construct confidence intervals, and conduct hypothesis tests. In this chapter, you will learn more about hypothesis tests. You will learn to:
A diagram showing the six steps of research, arranged in a cycle: Ask, Design, Collect, Classify and summarise, Analyse, Report. Step 5 (Analyse) is highlighted, captioned “Tests: more details”.
In Chaps. Chapter 26 and Chapter 27, hypothesis tests for one proportion and one mean were studied. Later chapters discuss hypothesis tests in other contexts, too. However, the general approach to hypothesis testing is the same for any hypothesis test. This chapter discusses some general ideas in hypothesis testing:
Section28.2More details about hypotheses and assumptions
Two statistical hypotheses are stated about the population parameter: the null hypothesis \(H_0\text{,}\) and the alternative hypothesis \(H_1\text{.}\) The null hypothesis is assumed to be true, and retained unless persuasive evidence exists to change our mind.
Scientific hypotheses refer to potential scientific explanations that can be tested by collecting data. For example, an engineer may hypothesise that replacing sand with glass in the manufacture of concrete will produce desirable characteristics [93]. Scientific hypotheses lead to research questions.
Statistical hypotheses refer to statements made about a parameter that may explain the value of a sample statistic. The statistical hypotheses are the foundation of the logic of hypothesis testing. One of the statistical hypotheses usually align with the scientific hypothesis.
Statistical hypotheses are always about a parameter. Hypothesising, for example, that the sample mean body temperature (in Chap. Chapter 27) is equal to \(37.0\)^o^C is silly: the sample mean clearly is \(36.8052\)^o^C for the sample taken, and its value will vary from sample to sample anyway. The RQ is about the unknown population: the P in POCI stands for Population.
The null hypothesis\(H_0\) proposes that sampling variation is why the value of the statistic (such as the sample mean) is not the same as the assumed value of the parameter (such as the population mean). Every sample is different, and the observed data is from just one of the many possible samples. The value of the statistic will vary from sample to sample; the statistic may not be equal to the parameter, just because of the random sample obtained and sampling variation.
The null hypothesis proposes that sampling variation explains the discrepancy between the proposed value of the parameter, and the observed value of the statistic.
Null hypotheses always contain an ’equals’, because (as part of the decision-making process) a specific value must be assumed for the parameter, so we can describe what we might expect from the sample. For example: the population mean equals\(100\text{,}\) is less than or equal to\(100\) (\(\le100\)), or is more than or equal to\(100\) (\(\ge100\)).
The null hypothesis always assumes the discrepancy between the statistic and the assumed value of the parameter is due to sampling variation. This may mean, for example:
there is no change in the value of the parameter compared to an established or accepted value (for descriptive RQs), such as in the body-temperature example in Chap. Chapter 27.
The null hypothesis always has the form ’no difference, no change, no relationship’ regarding the population parameter. It is the ’sampling variation’ explanation for the discrepancy between the value of the parameter and the value of the statistic.
The alternative hypothesis \(H_1\) (or \(H_a\)) offers another possible reason why the value of the statistic (such as the sample proportion) is not the same as the proposed value of the parameter (such as the population proportion): the value of the parameter really is not the value claimed in the null hypothesis.
The alternative hypothesis proposes that the discrepancy between the proposed value of the parameter and the observed value of the statistic cannot be explained by sampling variation. It proposes that the value of the parameter is not the value claimed in the null hypothesis.
Alternative hypotheses can be one-tailed or two-tailed. A two-tailed alternative hypothesis means, for example, that the population mean could be either smaller or larger than what is claimed. A one-tailed alternative hypothesis admits only one of those two possibilities. Most (but certainly not all) hypothesis tests are two-tailed.
The decision about whether the alternative hypothesis is one- or two-tailed depends on what the RQ asks (not by looking at the data). The RQ and hypotheses should (in principle) be formed before the data are obtained, or at least before looking at the data if the data are already collected.
The idea of hypothesis testing is the same whether the alternative hypothesis is one- or two-tailed: based on the data and the statistic, a decision is to be made about whether the data provides persuasive evidence to support the alternative hypothesis.
For the body-temperature study (Chap. Chapter 27), the alternative hypothesis is two-tailed (i.e., \(H_1\text{:}\)\(\mu \ne 37.0\)): the RQ asks if the population mean is \(37.0\)^o^C or not. Two possibilities are considered: that \(\mu\) could be either larger or smaller than \(37.0\text{.}\)
A one-tailed alternative hypothesis would be appropriate if the RQ asked ’Is the population mean internal body temperature greater than \(37.0\)^o^C?’ (i.e., \(H_1\text{:}\)\(\mu > 37.0\)), or ’Is the population mean internal body temperature smaller than \(37.0\)^o^C?’ (i.e., \(H_1\text{:}\)\(\mu < 37.0\)). One-tailed RQs such as these would only be asked if there were good scientific reasons to suspect a difference in one direction specifically.
null hypothesis always have the form ’no difference, no change, no relationship’ (i.e., sampling variation explains the discrepancy between the values of the parameter and statistic).
Section28.3More details about sampling distributions and expectations
The sampling distribution describes, approximately, how the value of the statistic (such as \(\hat{p}\) or \(\bar{x}\)) varies across all possible samples, when \(H_0\) is true; it describes the sampling distribution. Some sampling distributions have an approximate normal distribution.
When the sampling distribution is described by a normal distribution, the mean of the normal distribution (the sampling mean) is the parameter value given in the assumption (\(H_0\)), and the standard deviation of the normal distribution is called the standard error. However, not all sampling distributions are normal distributions.
The variation in the sampling distribution (as measured by the standard error) depends on the sample size. For example, suppose \(p\) is defined as the probability of rolling a ⚀ on a die. In one roll, finding a sample proportion of \(\hat{p} = 1\text{,}\) is not unreasonable. However, in \(20\,000\) rolls, a sample proportion of \(\hat{p} = 1\) would be incredibly unlikely for a fair die.
Section28.4More details about observations and the test statistic
The sampling distribution describes what values the statistic can take over all possible samples of a given size. When the sampling distribution has an approximate normal distribution, the observed value of the test statistic is
\begin{equation*}
\text{test statistic} = \frac{\text{value of sample statistic} - \text{centre of the sampling distribution}} {\text{standard deviation of the sampling distribution (i.e., standard error)}}.
\end{equation*}
The ’standard deviation of the sampling distribution’ is called the standard error of the statistic. This is called a ’test statistic’, since the calculation is based on sample data (so it is a statistic) and used in a hypothesis test. This test statistic may be a \(z\)-score or a \(t\)-score. Other test statistics, when the sampling distribution is not described by a normal distribution, are used too (as in Chap. Chapter 31).
For sampling distributions with an approximate normal distribution, a \(t\)-score and \(z\)-score both measure the number of standard deviations that a value is from the mean:
if the quantity that varies is an individual observation \(x\text{,}\) the measure of variation is the standard deviation of the individual observations.
When the sampling distribution has an approximate normal distribution, \(P\)-values can be approximated (using the \(68\)–\(95\)–\(99.7\) rule or tables), as demonstrated in Sect. Section 26.7. The \(P\)-value is the area more extreme than the calculated \(z\)- or \(t\)-score (i.e., in the tails of the distribution). The \(68\)–\(95\)–\(99.7\) rule can be used to approximate this tail area (when the sampling distribution has an approximate normal distribution).
A lower-case \(p\) or upper-case \(P\) can be used to denote a \(P\)-value. We use an upper-case \(P\text{,}\) since we use \(p\) to denote a population proportion.
For two-tailed tests, the \(P\)-value is the combined area in the left and right tails. For one-tailed tests, the \(P\)-value is the area in just the left or right tail (as appropriate, according to the alternative hypothesis; see Sect. Section 27.9).
A \(P\)-value is the likelihood of observing the sample statistic (or something more extreme) over repeated sampling, under the assumption that the null hypothesis about the population parameter is true.
Since the null hypothesis is initially assumed true, the onus is on the data to present evidence to contradict the null hypothesis. That is, the null hypothesis is retained unless persuasive evidence suggests otherwise.
Conclusions are always about the parameters. \(P\)-values tell us about the unknown parameters, based on the data from one of the many possible values of the statistic.
A ’big’ \(P\)-value means that the sample statistic (such as \(\hat{p}\)) could reasonably have occurred through sampling variation in one of the many possible samples, if the assumption made about the parameter (stated in \(H_0\)) was true. A ’small’ \(P\)-value means that the sample statistic (such as \(\hat{p}\)) is unlikely to have occurred through sampling variation in one of the many possible samples, if the assumption made about the parameter (stated in \(H_0\)) was true. ’Small’ \(P\)-values provide persuasive evidence to support the alternative hypothesis.
Commonly, a \(P\)-value smaller than \(5\)% (or \(0.05\)) is considered ’small’ but this is arbitrary, and sometimes the threshold is discipline-dependent. More reasonably, \(P\)-values should be interpreted as giving varying degrees of evidence in support of the alternative hypothesis (Table Table 28.15), but these too are only guidelines.
The threshold for a ’small’ \(P\)-value is very commonly \(0.05\text{,}\) but this is arbitrary and not universal. There is nothing special about the value \(0.05\text{,}\) and there is very little difference in the meaning of a \(P\)-value of \(0.051\) and a \(P\)-value of \(0.049\text{.}\)
Table28.15.A guideline for interpreting \(P\)-values. \(P\)-values should be interpreted in context, and indicate the strength of evidence to support the alternative hypothesis.
Identifying a \(P\)-value of \(0.05\) as ’small’ (and hence providing ’persuasive evidence’ to support \(H_1\)) is arbitrary; it means that, if \(H_0\) is true, there is a \(1\)-in-\(20\) chance that the value of the statistic (or a value more extreme) would be observed due to sampling variation. In many situations, the evidence must be more persuasive than this.
a small \(P\)-value does not necessarily mean a large difference between the statistic and parameter; it means that the difference (whether large or small) could not reasonably be attributed to sampling variation (chance).
\(P\)-values are never exactly zero. Some software reports very small \(P\)-values as ’\(P < 0.001\)’ (i.e., the \(P\)-value is smaller than \(0.001\)). Some software reports very small \(P\)-values as ’\(P = 0.000\)’ (i.e., zero to three decimal places). In either case, we should still write \(P < 0.001\text{.}\)
Sometimes the results of a study are reported as being statistically significant. This usually means that the \(P\)-value is less than \(0.05\text{,}\) though a different \(P\)-value is sometimes used as the ’threshold’, so check!
To avoid confusion, the word ’significant’ should be avoided in writing about research unless ’statistical significance’ is actually meant. In other situations, consider using words like ’substantial’.
Section28.7More details about how conclusions can go wrong
In hypothesis testing, a decision is made about a population using sample information. Since the observed sample is just one of countless possible samples that could have been observed, making an incorrect conclusion is always a possibility.
incorrectly concluding that evidence supports the alternative hypothesis. Of course, the researchers do not know they are incorrect, but the possibility of making this mistake is always present. This is a false positive, or a Type I error.
incorrectly concluding there is no evidence to support the alternative hypothesis. Of course, the researchers do not know they are incorrect, but the possibility of making this mistake is always present. This is a false negative, or a Type II error.
Ideally, neither of these errors would be made; however, sampling variation means that neither can ever be completely eliminated. In practice, hypothesis testing begins by assuming the null hypothesis is true, and hence places the onus on the data to provide persuasive evidence in favour of the alternative hypothesis. This means researchers usually prioritise minimising the chance of a Type I error.
A Type I error is like declaring an innocent person guilty (recall: innocence is presumed in the judicial system). Similarly, a Type II error is like declaring a guilty person innocent. The law generally sees a Type I error as more grievous than a Type II error, just as in research. In general, larger sample sizes reduce the probability of making Type I and Type II errors.
In medical contexts, the similar concepts of sensitivity and specificity are often used rather than the terms Type I and Type II errors. Sensitivity is the probability of a positive test result among those with the disease, and specificity is the probability of a negative test result among those without the disease. High sensitivity is associated with a low chance of Type II error, and higher specificity is associated with a low chance of a Type I.
For the body-temperature example (Chap. Chapter 27), the conclusion was that the sample provided very strong evidence that the population mean body temperature was not\(37.0\)^o^C. However, in truth, the mean internal body may not have changed, and is still \(37.0\)^o^C; that is, the null hypothesis actually is true, but we incorrectly decided it was probably not true.
This would be a Type I error: we incorrectly concluded that the evidence supported the alternative hypothesis. Of course, since the value of \(\mu\) is unknown, we do not know if we have made a Type I error or not.
Since we initially assume the null hypothesis is true, conclusions are worded (in context) in terms of how strongly the evidence supports the alternative hypothesis.
Since the null hypothesis is initially assumed to be true, the onus is on the data to provide evidence in support of the alternative hypothesis: the null hypothesis is retained unless persuasive evidence suggests otherwise. Hence, conclusions are always worded in terms of how much evidence supports the alternative hypothesis.
We do not say whether the evidence supports the null hypothesis; the null hypothesis is already assumed to be true. Even if the current sample presents no evidence to contradict the assumption, future evidence may emerge. That is:
Suppose, when we tested if the mean internal body temperature remained \(37.0\)^o^C (Chap. Chapter 27), that we found no evidence that the temperature had changed. This does not provide evidence that the mean internal body temperature is \(37.0\)^o^C. It just means that the sample provided no evidence to change our initial assumption that the mean internal body temperature is \(37.0\)^o^C.
Section28.9More details about practical importance, statistical significance
Hypothesis tests assess statistical significance, which answers the question: ’Can sampling variation reasonably explain the discrepancy between the value of the statistic and the assumed value of the parameter?’ Even very small discrepancies between the statistic and the parameter can be statistically different if the sample size is sufficiently large.
In contrast, practical importance answers the question: ’Is the discrepancy between the values of the statistic and the parameter of any importance in practice?’ Whether a result is of practical importance depends upon the context: what the data are being used for. ’Practical importance’ and ’statistical significance’ are separate issues.
In the body-temperature study (Sect. Section 27.1), very strong evidence exists that the mean body temperature had changed (’statistical significance’). But the change was so small that, for most purposes, it has no practical importance. In other (e.g., medical) situations, it may have practical importance.
This means that the difference in mean weight loss between the placebo and intervention groups was unlikely to be explained by chance (\(P < 0.001\text{;}\) i.e., ’statistical significant’), but the difference was so small that it was unlikely to be of any use in practice (’practical importance’). In this context, the researchers decided that a weight loss of at least \(2.5\kgs\) was of practical importance. However, in the study, the sample mean weight loss was \(1.61\kgs\text{.}\)
Section28.10More details about statistical validity
When performing hypothesis tests, statistical validity conditions must be true to ensure that the mathematics behind computing the \(P\)-value is sound. For instance, the statistical validity conditions may ensure that the sampling distribution is sufficiently like a normal distribution for the \(68\)–\(95\)–\(99.7\) rule to apply.
Hypothesis testing formalises the decision-making process. Starting with an assumption about a parameter of interest, a description of what values the statistic might take is produced (the sampling distribution): this describes what values the statistic is expected to take over all possible samples. This sampling distribution is often a normal distribution.
The statistic (the sample estimate) is then observed, and a test statistic is computed to quantify the discrepancy between the values of the parameter (given in \(H_0\)) and statistic. Using a \(P\)-value, a decision is made about whether the sample evidence supports or contradicts the initial assumption, and hence a conclusion is made. When the sampling distribution is an approximate normal distribution, the test statistic is a \(t\)-score or \(z\)-score, and \(P\)-values can often be approximated using the \(68\)–\(95\)–\(99.7\) rule.
When the sampling distribution has an approximate normal distribution, the standard deviation of this normal distribution is called the standard error.
Consider the test statistics in Exercise Exercise 28.13.1. Use the \(68\)–\(95\)–\(99.7\) rule to approximate the one-tailed \(P\)-values in each case.
Consider the test statistics in Exercise Exercise 28.13.2. Use the \(68\)–\(95\)–\(99.7\) rule to approximate the one-tailed \(P\)-values in each case.
Suppose a hypothesis test results in a \(P\)-value of \(0.0501\text{.}\) What would we conclude? What if the \(P\)-value was \(0.0499\text{?}\) Comment.
Consider the study to determine if the mean body temperature (Chap. Chapter 27) was \(37.0\)^o^C, where \(\bar{x} = 36.8052\)^o^C. Explain why each of these sets of hypotheses are incorrect.
Consider the study to determine if a die was loaded (Chap. Chapter 26) by studying the proportion of rolls that showed a ⚀, and where \(\hat{p} = 0.41\text{.}\) Explain why each of these sets of hypotheses are incorrect.
The recommended daily energy intake for women is \(7\,725\) kJ (for a particular cohort, in a particular country; [205]). The daily energy intake for \(11\) women was measured to see if this is being adhered to. The RQ was ’Is the population mean daily energy intake \(7\,725\) kJ?’
[Dataset: Battery] A study compared ALDI batteries to another brand of battery. In one test (comparing the time taken for \(1.5\vs\) AA batteries to reach \(1.1\vs\)), the ALDI brand battery took \(5.73\hs\text{,}\) and the other brand (Energizer) took \(5.44\hs\)[289].
An ecologist was compared the proportion of female and male dingoes kept in zoos that showed signs of mange (a skin disease). She finds ’no statistically significant’ difference between the proportions of female and male dingoes with evidence of mange.
The study of body temperatures (Chap. Chapter 27) also compared the mean internal body temperatures for females and males [34]. The study concludes that there is moderate evidence of a difference between the mean temperatures of females and males.