To find the test statistic (T-score), we first must determine the standard error:
\begin{equation*}
SE = 16.98 / \sqrt{100} = 1.70
\end{equation*}
Now we can compute the
T-score using the sample mean (97.32), null value (93.29), and
\(SE\text{:}\)
\begin{equation*}
T = \frac{97.32 - 93.29}{1.70} = 2.37
\end{equation*}
For
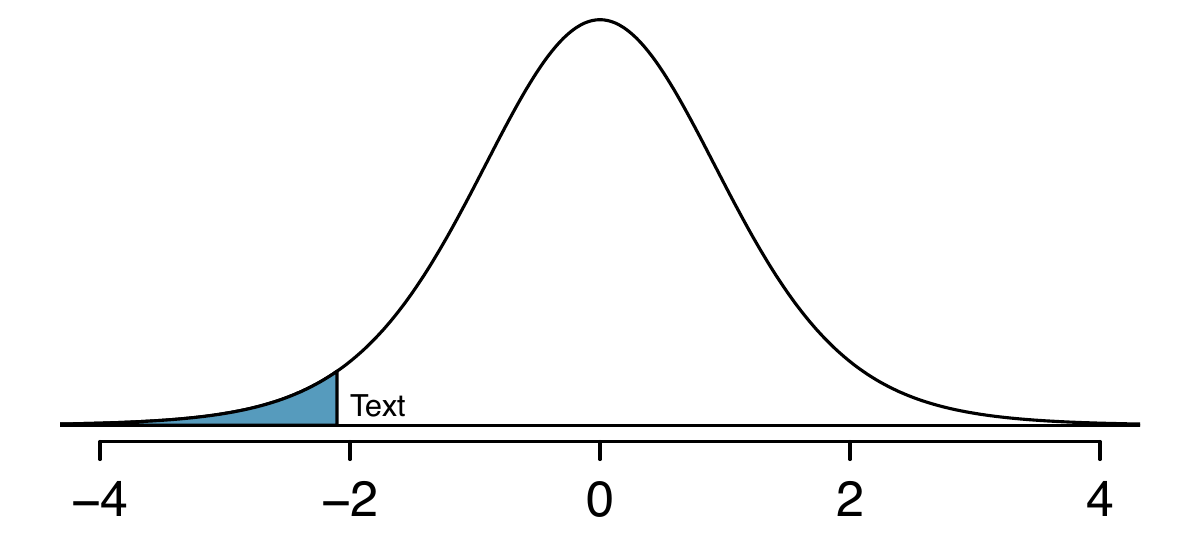
\(df = 100 - 1 = 99\text{,}\) we can determine using statistical software (or a
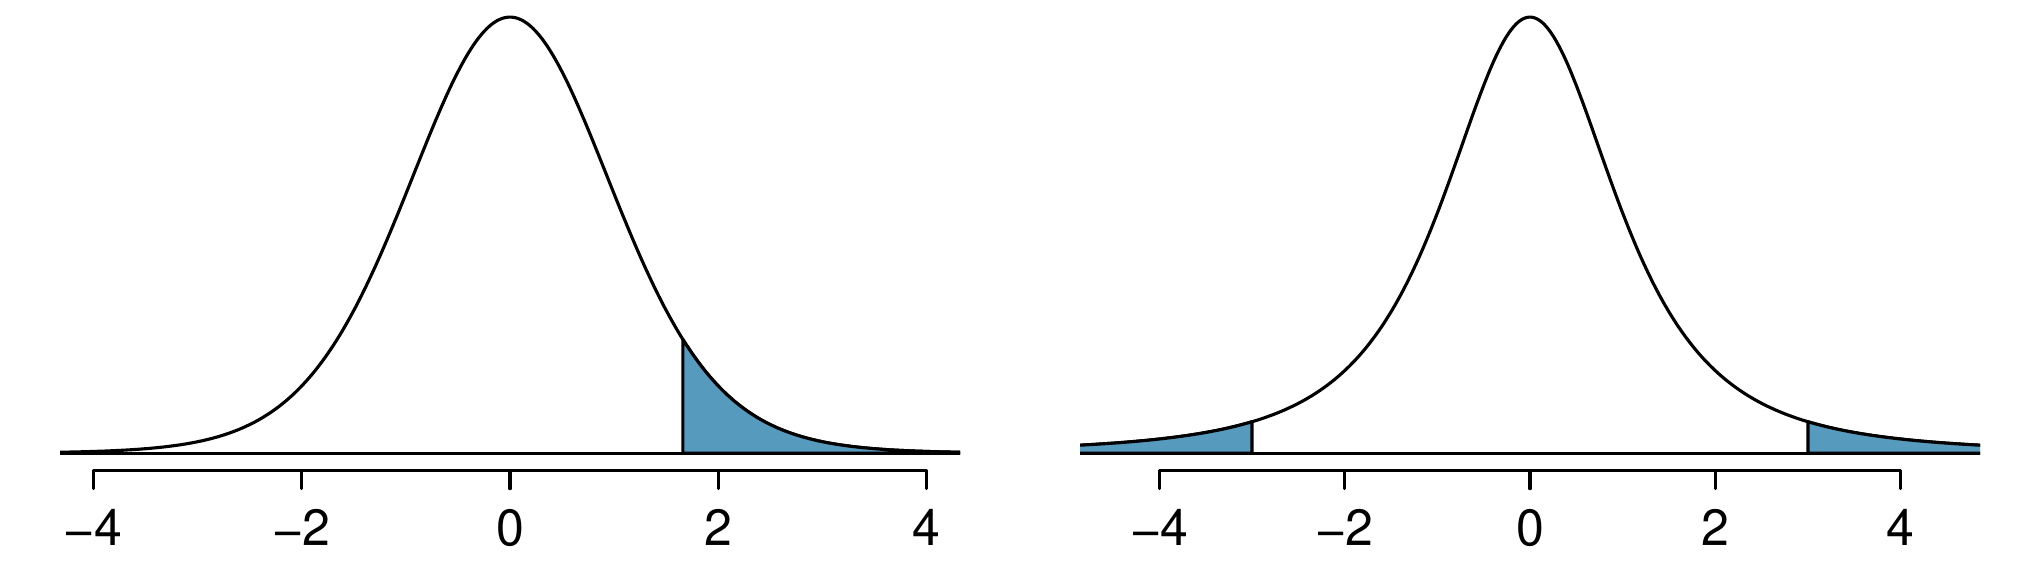
\(t\)-table) that the one-tail area is 0.01, which we double to get the p-value: 0.02.
Because the p-value is smaller than 0.05, we reject the null hypothesis. That is, the data provide strong evidence that the average run time for the Cherry Blossom Run in 2017 is different than the 2006 average. Since the observed value is above the null value and we have rejected the null hypothesis, we would conclude that runners in the race were slower on average in 2017 than in 2006.