Introductory Statistics

Section 1.3 Sampling principles and strategies

The first step in conducting research is to identify topics or questions that are to be investigated. A clearly laid out research question is helpful in identifying what subjects or cases should be studied and what variables are important. It is also important to consider how data are collected so that they are reliable and help achieve the research goals.

Subsection 1.3.1 Populations and samples

Consider the following three research questions:
  1. What is the average mercury content in swordfish in the Atlantic Ocean?
  2. Over the last 5 years, what is the average time to complete a degree for Duke undergrads?
  3. Does a new drug reduce the number of deaths in patients with severe heart disease?
Each research question refers to a target population. In the first question, the target population is all swordfish in the Atlantic Ocean, and each fish represents a case. Often times, it is too expensive to collect data for every case in a population. Instead, a sample is taken. A sample represents a subset of the cases and is often a small fraction of the population. For instance, 60 swordfish (or some other number) in the population might be selected, and this sample data may be used to provide an estimate of the population average and answer the research question.

Checkpoint 1.3.1. Identifying populations.

For the second and third questions above, identify the target population and what represents an individual case.
Solution.
(2) This question is only relevant to students who complete their degree; the average cannot be computed using a student who never finished her degree. Thus, only Duke undergrads who graduated in the last five years represent cases in the population under consideration. Each such student is an individual case. (3) A person with severe heart disease represents a case. The population includes all people with severe heart disease.
Subsection 1.3.2 Anecdotal evidence

Consider the following possible responses to the three research questions:
  1. A man on the news got mercury poisoning from eating swordfish, so the average mercury concentration in swordfish must be dangerously high.
  2. I met two students who took more than 7 years to graduate from Duke, so it must take longer to graduate at Duke than at many other colleges.
  3. My friend’s dad had a heart attack and died after they gave him a new heart disease drug, so the drug must not work.
Each conclusion is based on data. However, there are two problems. First, the data only represent one or two cases. Second, and more importantly, it is unclear whether these cases are actually representative of the population. Data collected in this haphazard fashion are called anecdotal evidence.
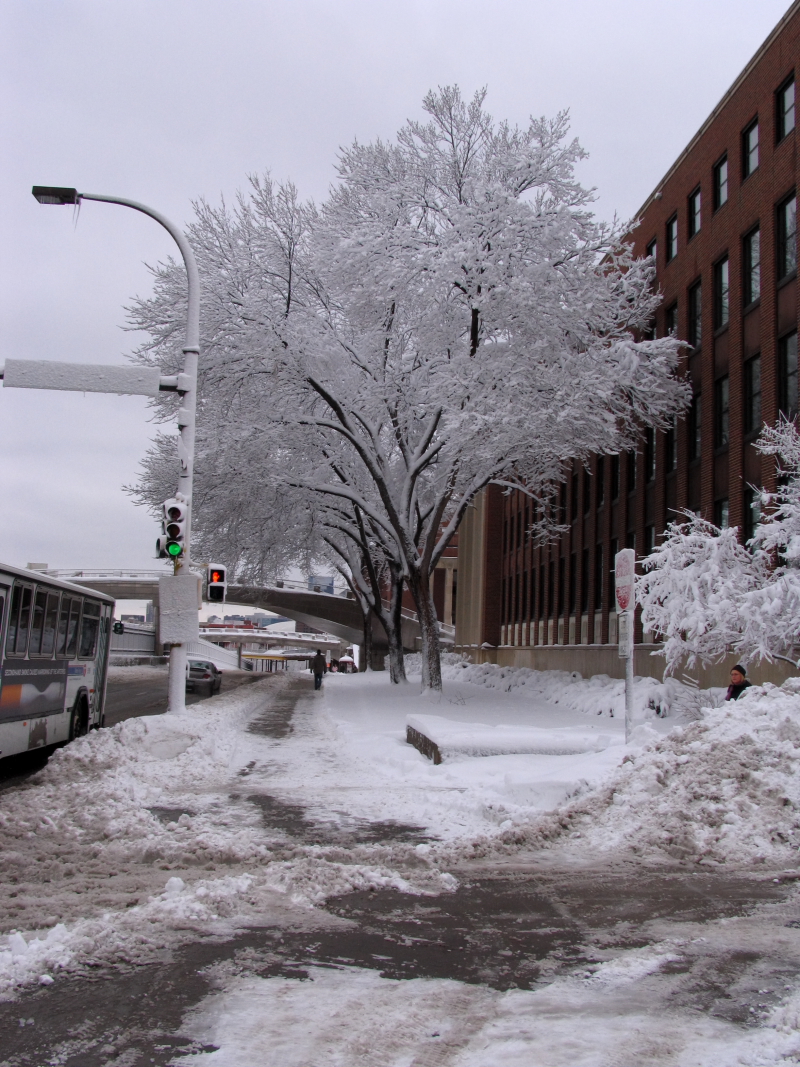
A wintery scene, where the trees are covered in snow, and there are large piles of snow on the sides of the roads.
Figure 1.3.2. In February 2010, some media pundits cited one large snow storm as valid evidence against global warming. As comedian Jon Stewart pointed out, β€œIt’s one storm, in one region, of one country.”

Anecdotal evidence.

Be careful of data collected in a haphazard fashion. Such evidence may be true and verifiable, but it may only represent extraordinary cases.
Anecdotal evidence typically is composed of unusual cases that we recall based on their striking characteristics. For instance, we are more likely to remember the two people we met who took 7 years to graduate than the six others who graduated in four years. Instead of looking at the most unusual cases, we should examine a sample of many cases that represent the population.

Subsection 1.3.3 Sampling from a population

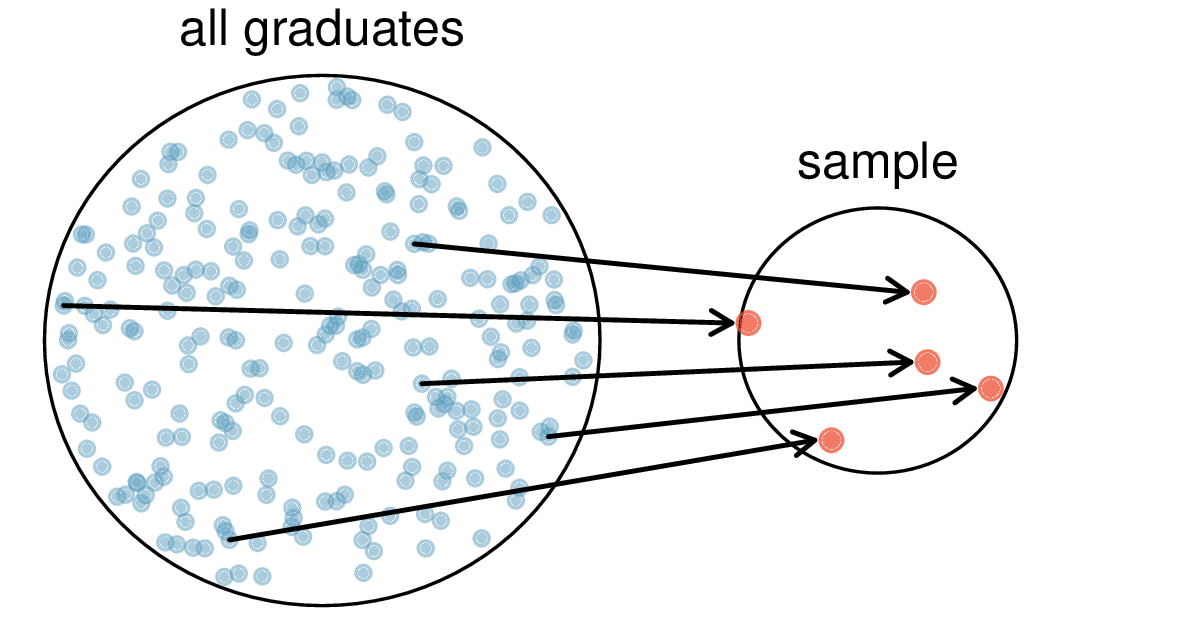
We might try to estimate the time to graduation for Duke undergraduates in the last 5 years by collecting a sample of students. All graduates in the last 5 years represent the population, and graduates who are selected for review are collectively called the sample. In general, we always seek to randomly select a sample from a population. The most basic type of random selection is equivalent to how raffles are conducted. For example, in selecting graduates, we could write each graduate’s name on a raffle ticket and draw 100 tickets. The selected names would represent a random sample of 100 graduates. We pick samples randomly to reduce the chance we introduce biases.
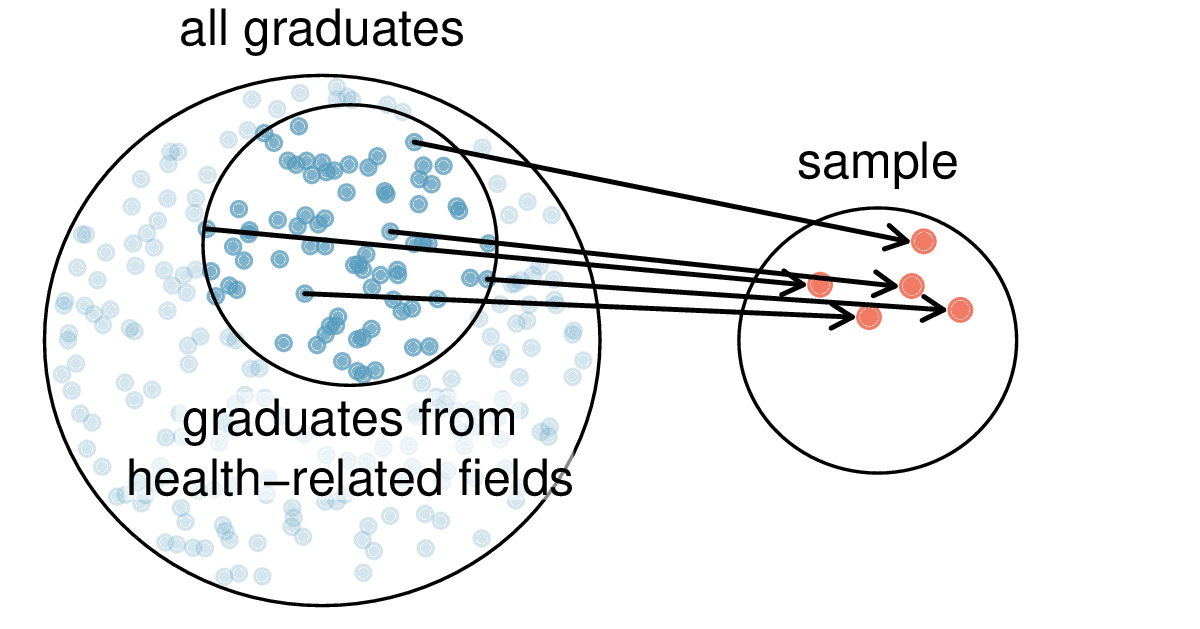
Graphic showing a larger circle on the left for all graduates and a smaller circle on the right for sample. Five graduates are randomly selected with arrows showing the selection.
Figure 1.3.3. In this graphic, five graduates are randomly selected from the population to be included in the sample.

Example 1.3.4. Unintentional bias.

Suppose we ask a student who happens to be majoring in nutrition to select several graduates for the study. What kind of students do you think she might collect? Do you think her sample would be representative of all graduates?
Perhaps she would pick a disproportionate number of graduates from health-related fields. Or perhaps her selection would be a good representation of the population. When selecting samples by hand, we run the risk of picking a biased sample, even if their bias isn’t intended.
Graphic showing sampling only from a subset (health-related fields) introduces bias.
Figure 1.3.5. Asked to pick a sample of graduates, a nutrition major might inadvertently pick a disproportionate number of graduates from health-related majors.
If someone was permitted to pick and choose exactly which graduates were included in the sample, it is entirely possible that the sample could be skewed to that person’s interests, which may be entirely unintentional. This introduces bias into a sample. Sampling randomly helps resolve this problem. The most basic random sample is called a simple random sample, which is equivalent to using a raffle to select cases. This means that each case in the population has an equal chance of being included and there is no implied connection between the cases in the sample.
The act of taking a simple random sample helps minimize bias. However, bias can crop up in other ways. Even when people are picked at random, e.g. for surveys, caution must be exercised if the non-response rate is high. For instance, if only 30% of the people randomly sampled for a survey actually respond, then it is unclear whether the results are representative of the entire population. This non-response bias can skew results.
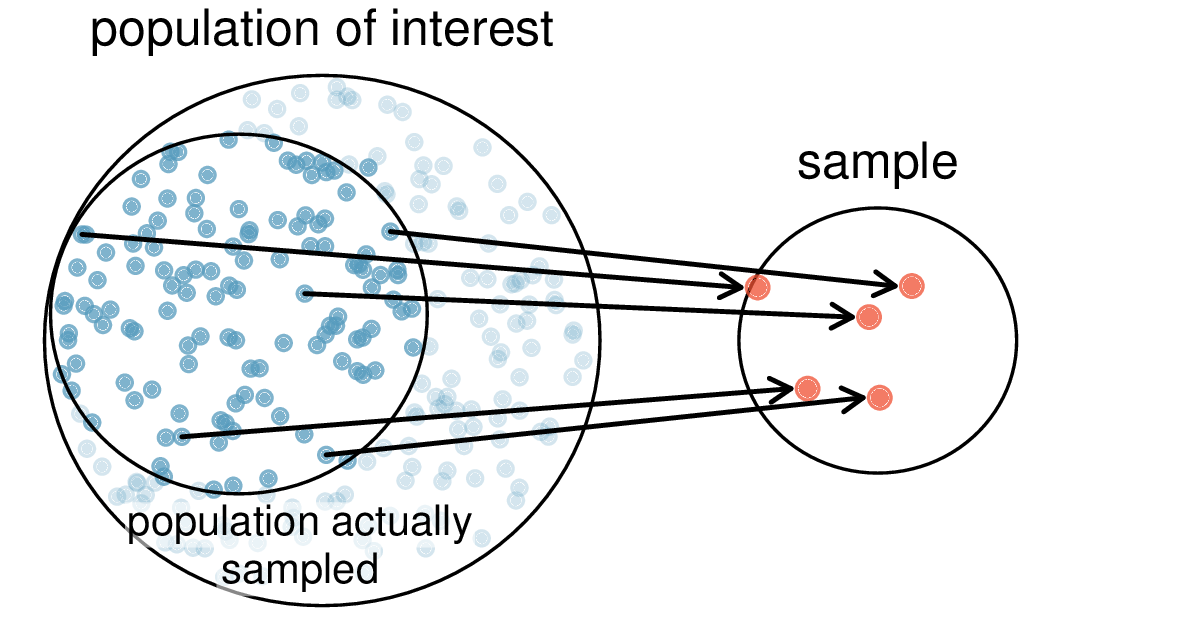
Graphic showing a population of interest with a smaller circle representing the population actually sampled, from which a sample is drawn.
Figure 1.3.6. Due to the possibility of non-response, survey studies may only reach a certain group within the population. It is difficult, and often times impossible, to completely fix this problem.
Another common downfall is a convenience sample, where individuals who are easily accessible are more likely to be included in the sample. For instance, if a political survey is done by stopping people walking in the Bronx, this will not represent all of New York City. It is often difficult to discern what sub-population a convenience sample represents.

Checkpoint 1.3.7. Interpreting online reviews.

We can easily access ratings for products, sellers, and companies through websites. These ratings are based only on those people who go out of their way to provide a rating. If 50% of online reviews for a product are negative, do you think this means that 50% of buyers are dissatisfied with the product?
Solution.
Answers will vary. From our own anecdotal experiences, we believe people tend to rant more about products that fell below expectations than rave about those that perform as expected. For this reason, we suspect there is a negative bias in product ratings on sites like Amazon. However, since our experiences may not be representative, we also keep an open mind.

Subsection 1.3.4 Observational studies

Data where no treatment has been explicitly applied (or explicitly withheld) is called observational data. For instance, the loan data and county data described in SectionΒ 1.2 are both examples of observational data. Making causal conclusions based on experiments is often reasonable. However, making the same causal conclusions based on observational data can be treacherous and is not recommended. Thus, observational studies are generally only sufficient to show associations or form hypotheses that we later check using experiments.

Checkpoint 1.3.8. Sunscreen and skin cancer.

Suppose an observational study tracked sunscreen use and skin cancer, and it was found that the more sunscreen someone used, the more likely the person was to have skin cancer. Does this mean sunscreen causes skin cancer?
Solution.
No. See the paragraph following the exercise for an explanation.
Some previous research tells us that using sunscreen actually reduces skin cancer risk, so maybe there is another variable that can explain this hypothetical association between sunscreen usage and skin cancer. One important piece of information that is absent is sun exposure. If someone is out in the sun all day, she is more likely to use sunscreen and more likely to get skin cancer. Exposure to the sun is unaccounted for in the simple investigation.
Diagram showing three boxes in a triangle: sun exposure at the top with arrows pointing to use sunscreen and skin cancer below, with a question mark on a lighter arrow between use sunscreen and skin cancer.
Figure 1.3.9. Sun exposure is a confounding variable that is associated with both sunscreen use and skin cancer.
Sun exposure is what is called a confounding variable,
 1 
Also called a lurking variable, confounding factor, or a confounder.
which is a variable that is correlated with both the explanatory and response variables. While one method to justify making causal conclusions from observational studies is to exhaust the search for confounding variables, there is no guarantee that all confounding variables can be examined or measured.

Checkpoint 1.3.10. Confounding in county data.

FigureΒ 1.2.11 shows a negative association between the homeownership rate and the percentage of multi-unit structures in a county. However, it is unreasonable to conclude that there is a causal relationship between the two variables. Suggest a variable that might explain the negative relationship.
Solution.
Answers will vary. Population density may be important. If a county is very dense, then this may require a larger fraction of residents to live in multi-unit structures. Additionally, the high density may contribute to increases in property value, making homeownership infeasible for many residents.
Observational studies come in two forms: prospective and retrospective studies. A prospective study identifies individuals and collects information as events unfold. For instance, medical researchers may identify and follow a group of patients over many years to assess the possible influences of behavior on cancer risk. One example of such a study is The Nurses’ Health Study, started in 1976 and expanded in 1989. This prospective study recruits registered nurses and then collects data from them using questionnaires. Retrospective studies collect data after events have taken place, e.g. researchers may review past events in medical records. Some data sets may contain both prospectively- and retrospectively-collected variables.

Subsection 1.3.5 Four sampling methods

Almost all statistical methods are based on the notion of implied randomness. If observational data are not collected in a random framework from a population, these statistical methodsβ€”the estimates and errors associated with the estimatesβ€”are not reliable. Here we consider four random sampling techniques: simple, stratified, cluster, and multistage sampling. FigureΒ 1.3.11 and FigureΒ 1.3.13 provide graphical representations of these techniques.
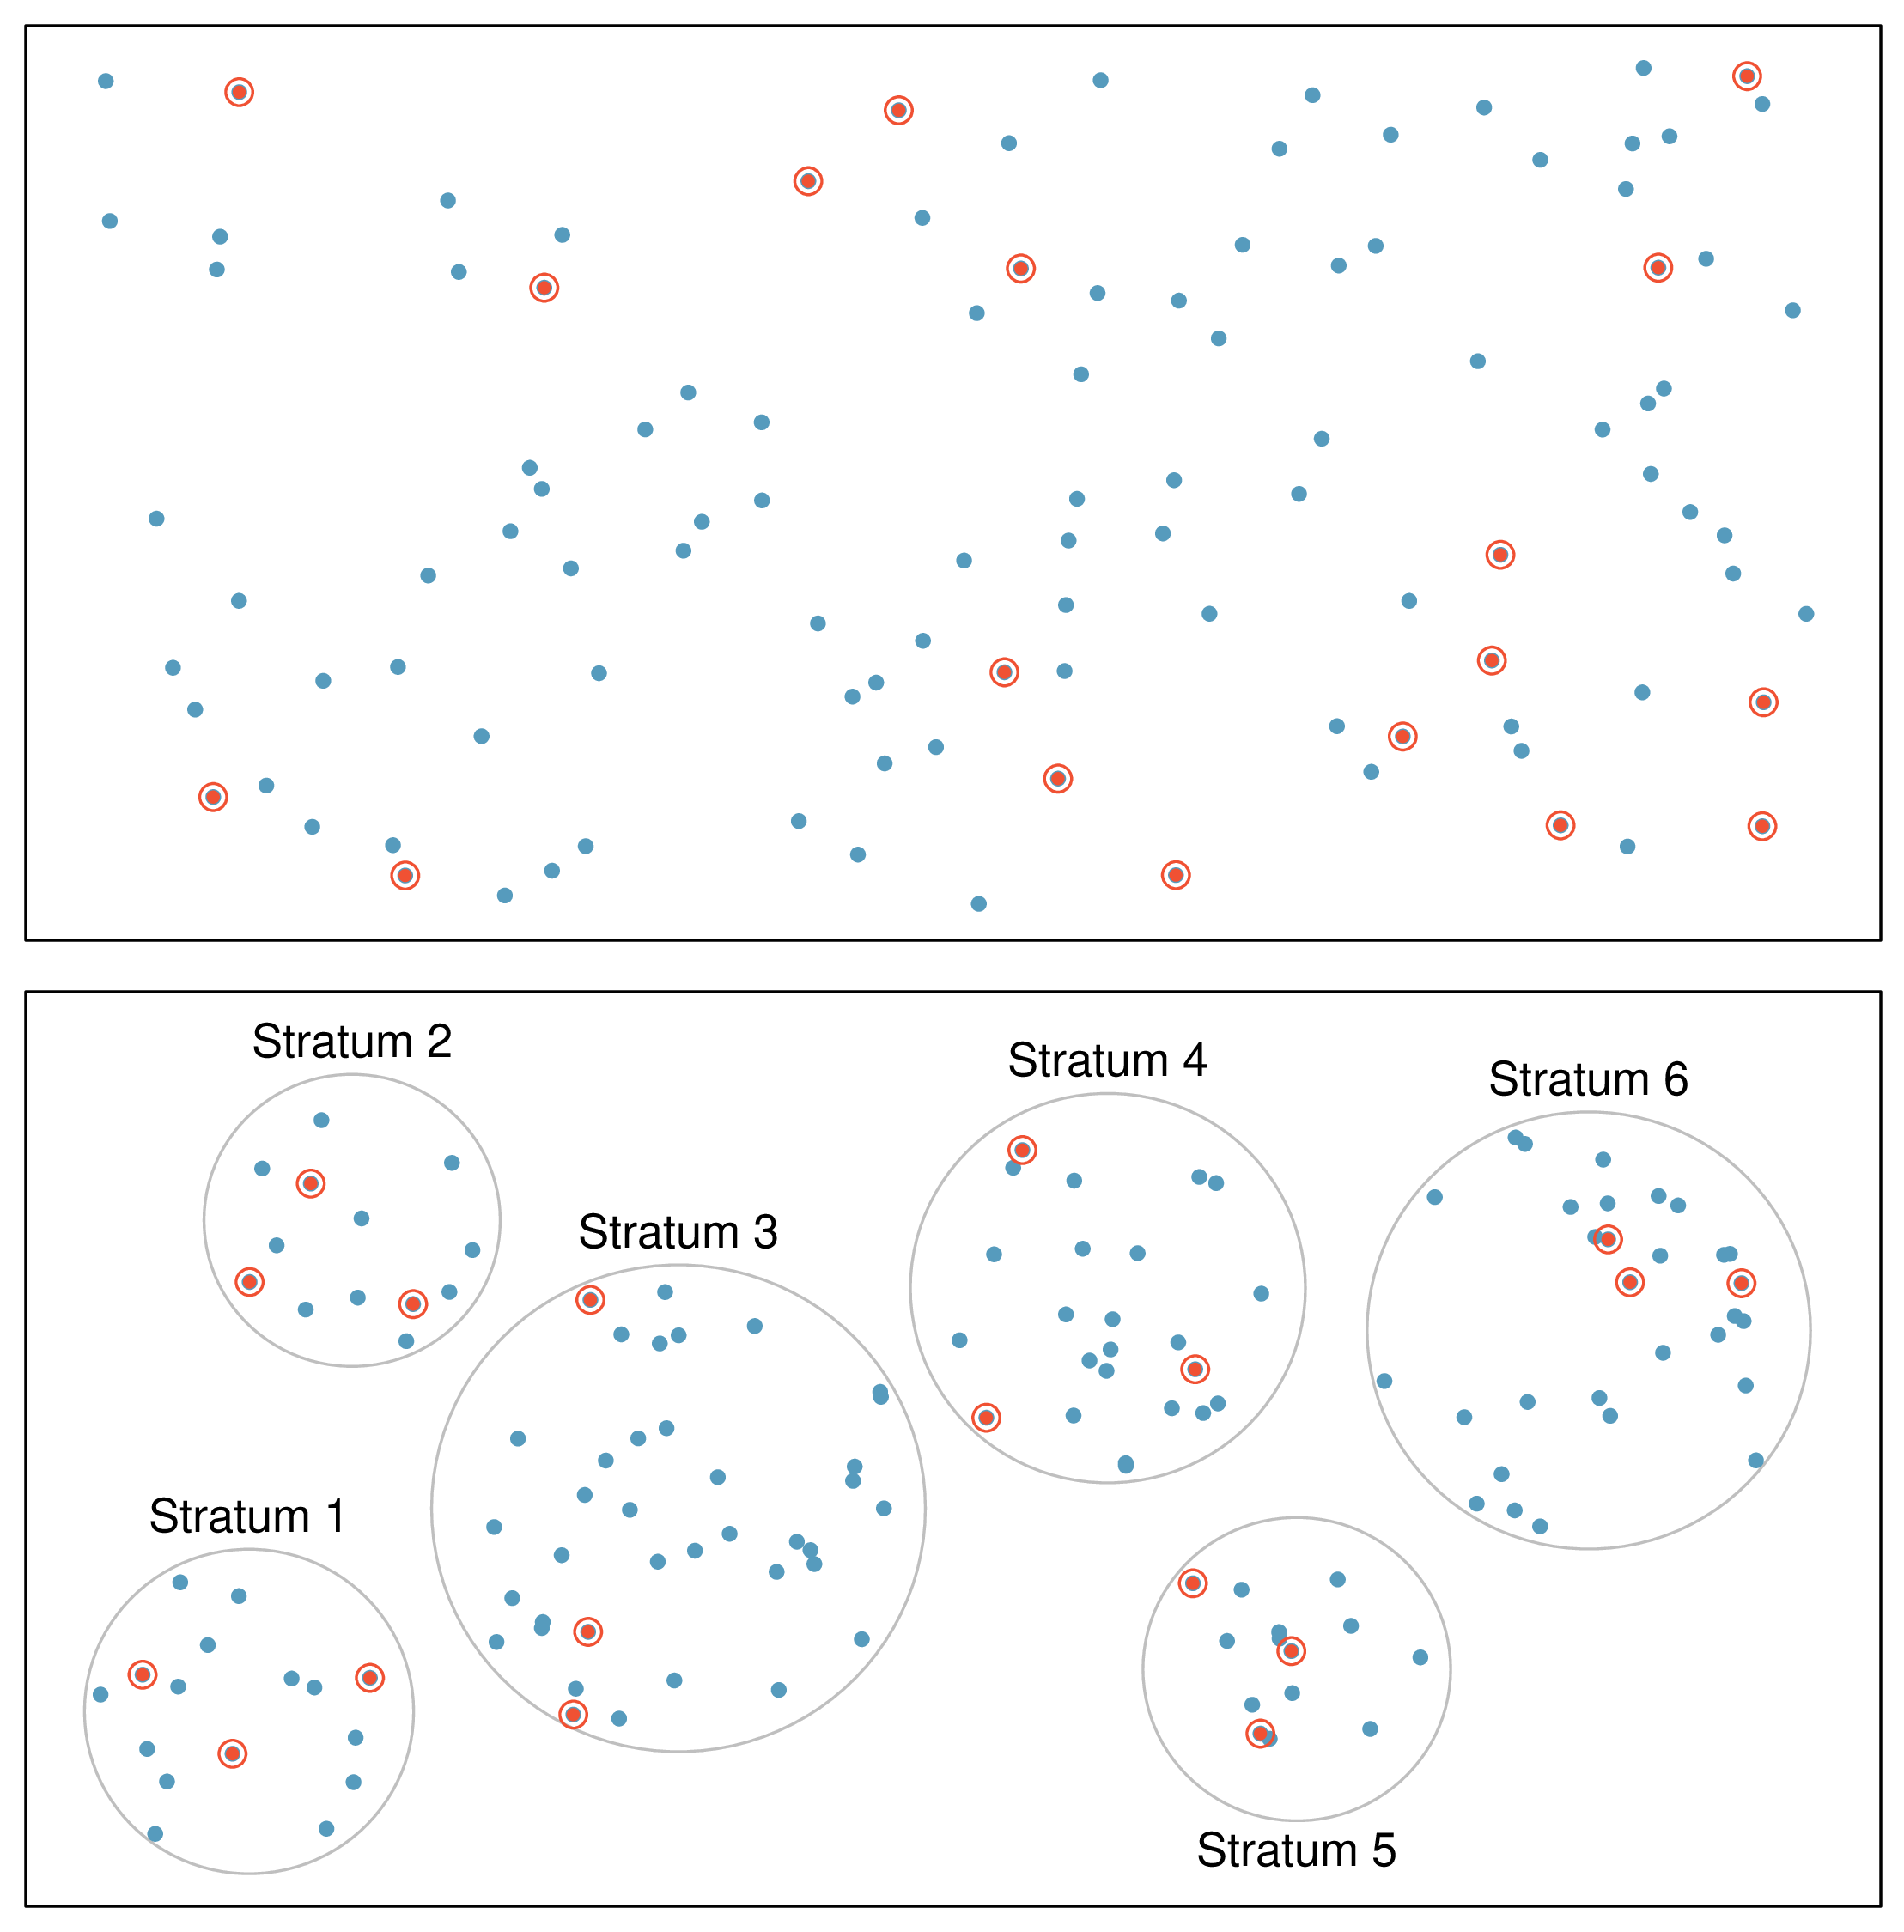
Two figures showing simple random sampling (top) with 18 randomly selected points, and stratified sampling (bottom) with 6 strata and 3 points selected from each stratum.
Figure 1.3.11. Examples of simple random and stratified sampling. In the top panel, simple random sampling was used to randomly select the 18 cases. In the bottom panel, stratified sampling was used: cases were grouped into strata, then simple random sampling was employed within each stratum.
Simple random sampling is probably the most intuitive form of random sampling. Consider the salaries of Major League Baseball (MLB) players, where each player is a member of one of the league’s 30 teams. To take a simple random sample of 120 baseball players and their salaries, we could write the names of that season’s several hundreds of players onto slips of paper, drop the slips into a bucket, shake the bucket around until we are sure the names are all mixed up, then draw out slips until we have the sample of 120 players. In general, a sample is referred to as β€œsimple random” if each case in the population has an equal chance of being included in the final sample and knowing that a case is included in a sample does not provide useful information about which other cases are included.
Stratified sampling is a divide-and-conquer sampling strategy. The population is divided into groups called strata. The strata are chosen so that similar cases are grouped together, then a second sampling method, usually simple random sampling, is employed within each stratum. In the baseball salary example, the teams could represent the strata, since some teams have a lot more money (up to 4 times as much!). Then we might randomly sample 4 players from each team for a total of 120 players.
Stratified sampling is especially useful when the cases in each stratum are very similar with respect to the outcome of interest. The downside is that analyzing data from a stratified sample is a more complex task than analyzing data from a simple random sample. The analysis methods introduced in this book would need to be extended to analyze data collected using stratified sampling.

Example 1.3.12. Benefits of stratified sampling.

Why would it be good for cases within each stratum to be very similar?
We might get a more stable estimate for the subpopulation in a stratum if the cases are very similar, leading to more precise estimates within each group. When we combine these estimates into a single estimate for the full population, that population estimate will tend to be more precise since each individual group estimate is itself more precise.
In a cluster sample, we break up the population into many groups, called clusters. Then we sample a fixed number of clusters and include all observations from each of those clusters in the sample. A multistage sample is like a cluster sample, but rather than keeping all observations in each cluster, we collect a random sample within each selected cluster.
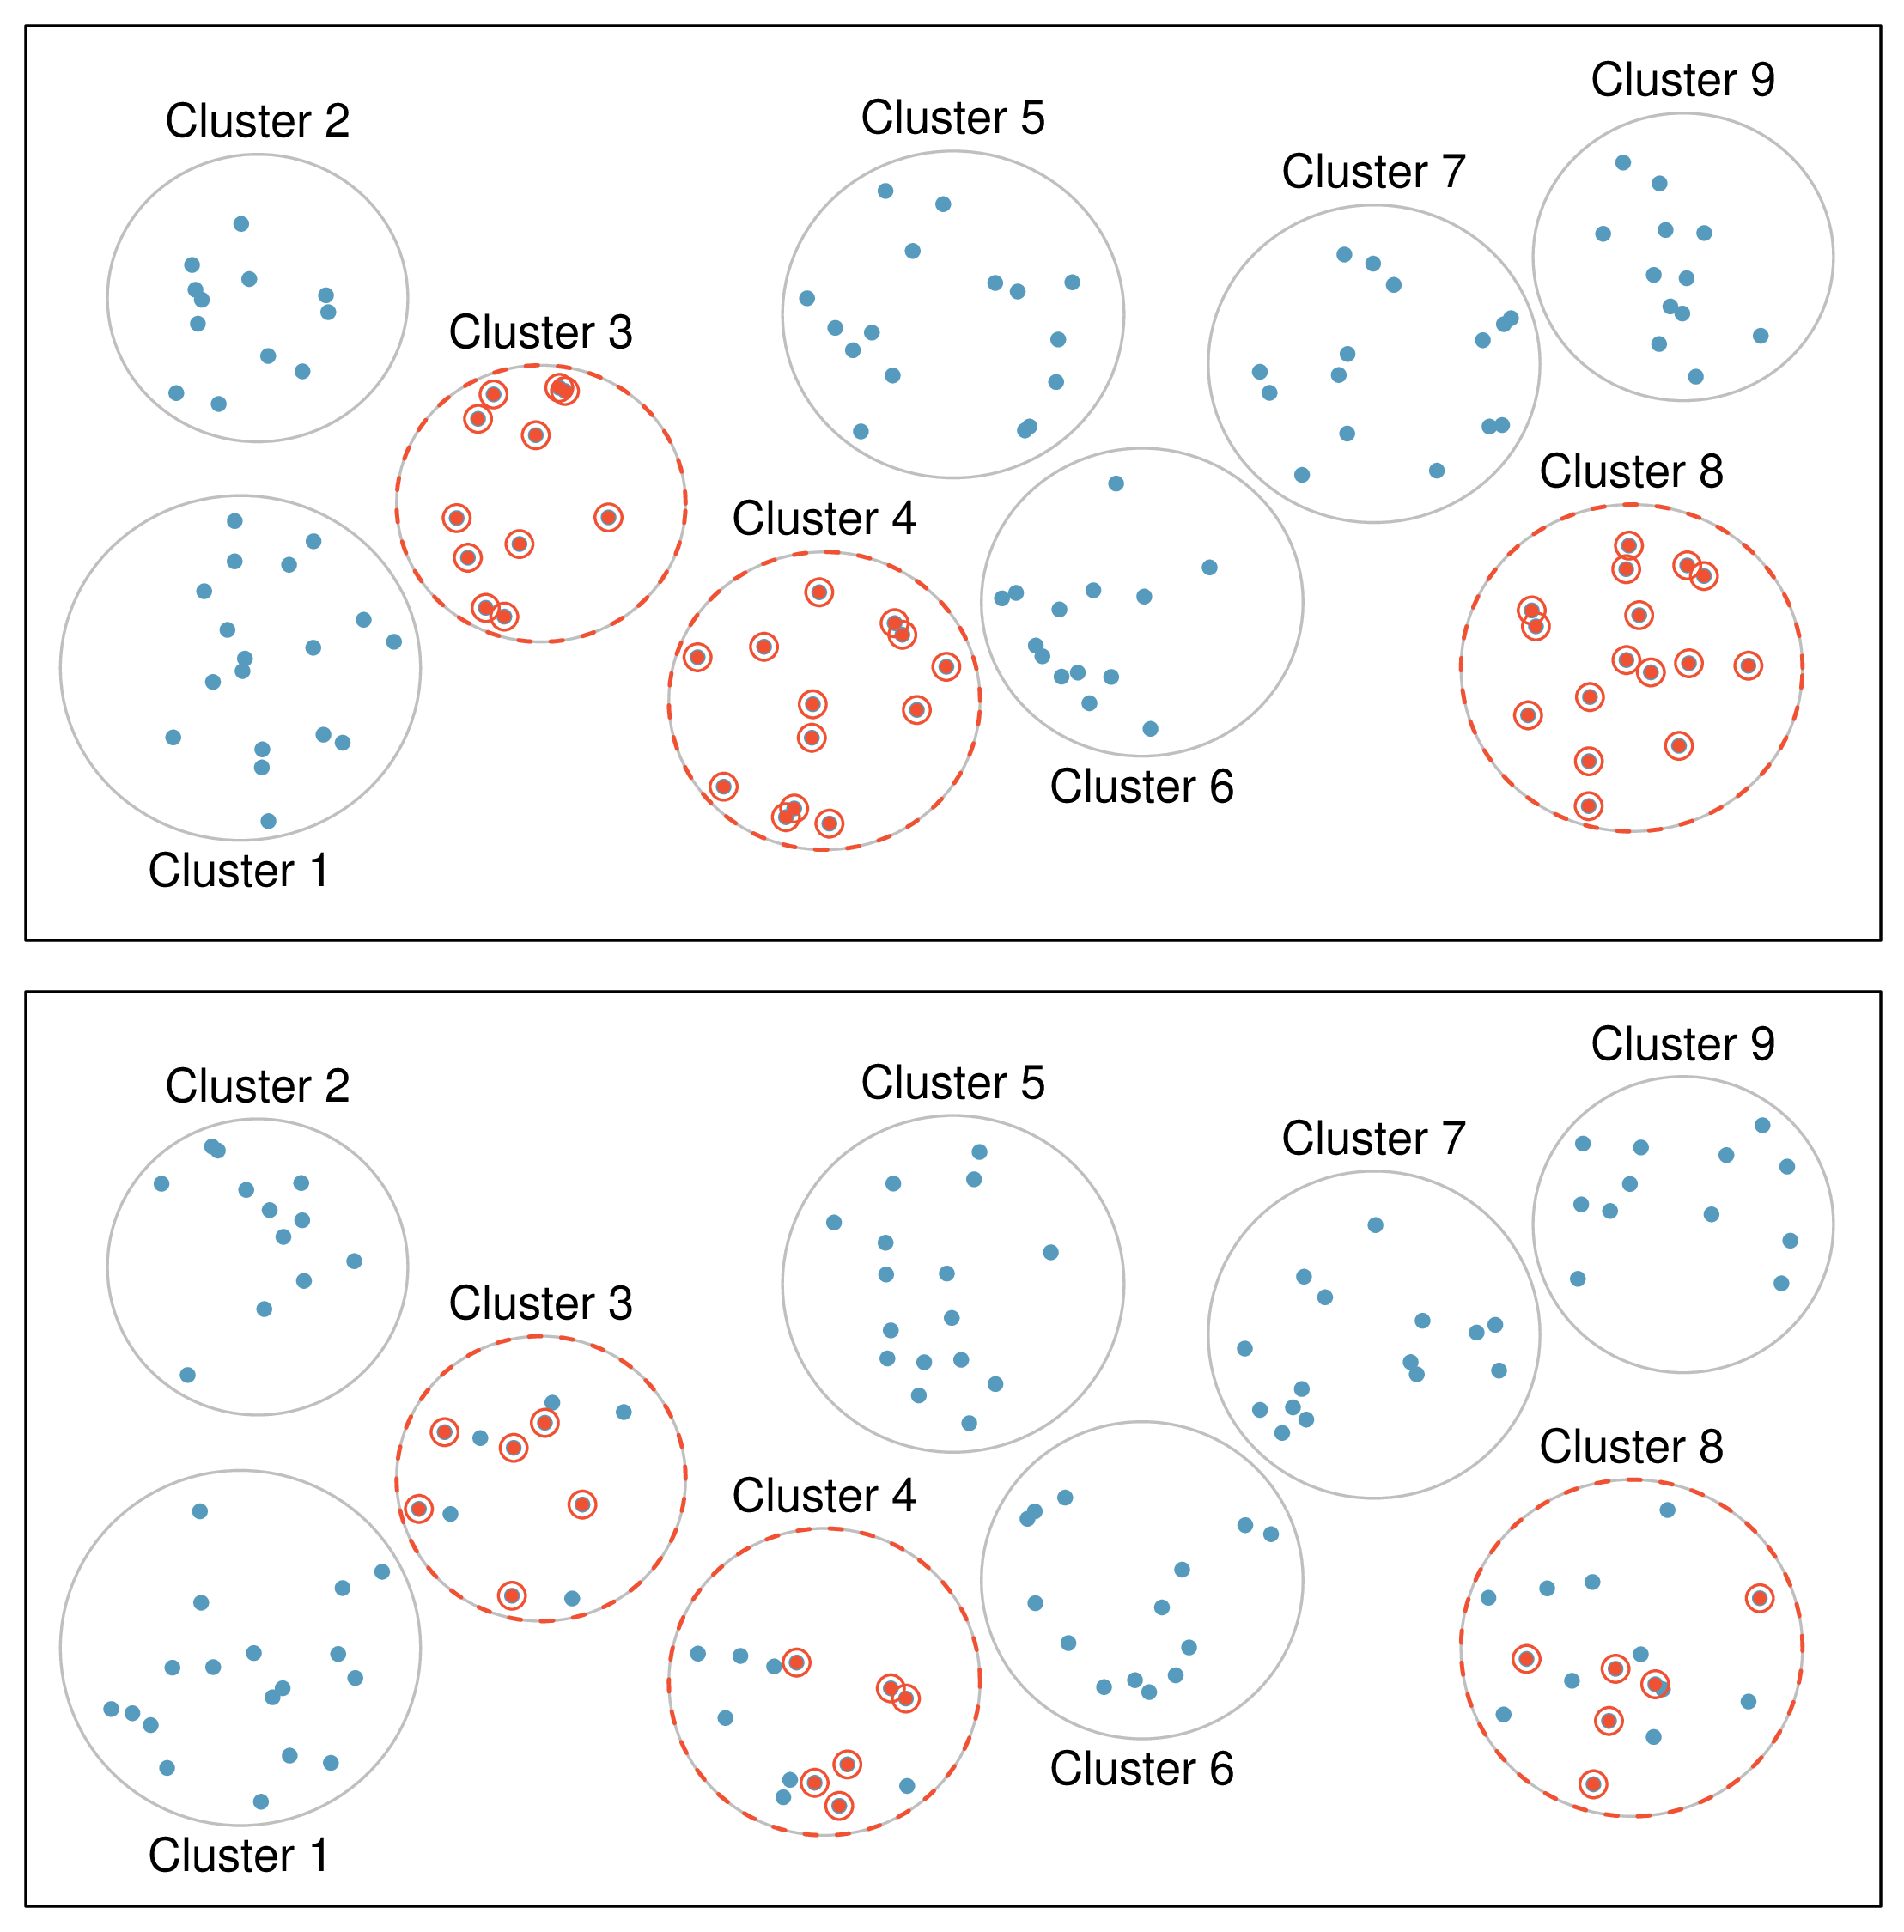
Two figures showing cluster sampling (top) with all observations from selected clusters, and multistage sampling (bottom) with random samples from within selected clusters.
Figure 1.3.13. Examples of cluster and multistage sampling. In the top panel, cluster sampling was used: data were binned into nine clusters, three of these clusters were sampled, and all observations within these three clusters were included in the sample. In the bottom panel, multistage sampling was used, which differs from cluster sampling only in that we randomly select a subset of each cluster to be included in the sample rather than measuring every case in each sampled cluster.
Sometimes cluster or multistage sampling can be more economical than the alternative sampling techniques. Also, unlike stratified sampling, these approaches are most helpful when there is a lot of case-to-case variability within a cluster but the clusters themselves don’t look very different from one another. For example, if neighborhoods represented clusters, then cluster or multistage sampling work best when the neighborhoods are very diverse. A downside of these methods is that more advanced techniques are typically required to analyze the data, though the methods in this book can be extended to handle such data.

Example 1.3.14. Choosing a sampling design.

Suppose we are interested in estimating the malaria rate in a densely tropical portion of rural Indonesia. We learn that there are 30 villages in that part of the Indonesian jungle, each more or less similar to the next. Our goal is to test 150 individuals for malaria. What sampling method should be employed?
A simple random sample would likely draw individuals from all 30 villages, which could make data collection extremely expensive. Stratified sampling would be a challenge since it is unclear how we would build strata of similar individuals. However, cluster sampling or multistage sampling seem like very good ideas. If we decided to use multistage sampling, we might randomly select half of the villages, then randomly select 10 people from each. This would probably reduce our data collection costs substantially in comparison to a simple random sample, and the cluster sample would still give us reliable information, even if we would need to analyze the data with slightly more advanced methods than we discuss in this book.

Exercises 1.3.6 Exercises

1. Air pollution and birth outcomes, scope of inference.

ExerciseΒ 1.2.6.1 introduces a study where researchers collected data to examine the relationship between air pollutants and preterm births in Southern California. During the study air pollution levels were measured by air quality monitoring stations. Length of gestation data were collected on 143,196 births between the years 1989 and 1993, and air pollution exposure during gestation was calculated for each birth.
  1. Identify the population of interest and the sample in this study.
  2. Comment on whether or not the results of the study can be generalized to the population, and if the findings of the study can be used to establish causal relationships.

2. Cheaters, scope of inference.

ExerciseΒ 1.2.6.3 introduces a study where researchers studying the relationship between honesty, age, and self-control conducted an experiment on 160 children between the ages of 5 and 15. The researchers asked each child to toss a fair coin in private and to record the outcome (white or black) on a paper sheet, and said they would only reward children who report white. Half the students were explicitly told not to cheat and the others were not given any explicit instructions. Differences were observed in the cheating rates in the instruction and no instruction groups, as well as some differences across children’s characteristics within each group.
  1. Identify the population of interest and the sample in this study.
  2. Comment on whether or not the results of the study can be generalized to the population, and if the findings of the study can be used to establish causal relationships.

3. Buteyko method, scope of inference.

ExerciseΒ 1.2.6.2 introduces a study on using the Buteyko shallow breathing technique to reduce asthma symptoms and improve quality of life. As part of this study 600 asthma patients aged 18-69 who relied on medication for asthma treatment were recruited and randomly assigned to two groups: one practiced the Buteyko method and the other did not. Those in the Buteyko group experienced, on average, a significant reduction in asthma symptoms and an improvement in quality of life.
  1. Identify the population of interest and the sample in this study.
  2. Comment on whether or not the results of the study can be generalized to the population, and if the findings of the study can be used to establish causal relationships.

4. Stealers, scope of inference.

ExerciseΒ 1.2.6.4 introduces a study on the relationship between socio-economic class and unethical behavior. As part of this study 129 University of California Berkeley undergraduates were asked to identify themselves as having low or high social-class by comparing themselves to others with the most (least) money, most (least) education, and most (least) respected jobs. They were also presented with a jar of individually wrapped candies and informed that the candies were for children in a nearby laboratory, but that they could take some if they wanted. After completing some unrelated tasks, participants reported the number of candies they had taken. It was found that those who were identified as upper-class took more candy than others.
  1. Identify the population of interest and the sample in this study.
  2. Comment on whether or not the results of the study can be generalized to the population, and if the findings of the study can be used to establish causal relationships.

5. Relaxing after work.

The General Social Survey asked the question, "After an average work day, about how many hours do you have to relax or pursue activities that you enjoy?" to a random sample of 1,155 Americans. The average relaxing time was found to be 1.65 hours. Determine which of the following is an observation, a variable, a sample statistic (value calculated based on the observed sample), or a population parameter.
  1. An American in the sample.
  2. Number of hours spent relaxing after an average work day.
  3. 1.65.
  4. Average number of hours all Americans spend relaxing after an average work day.

6. Cats on YouTube.

Suppose you want to estimate the percentage of videos on YouTube that are cat videos. It is impossible for you to watch all videos on YouTube so you use a random video picker to select 1000 videos for you. You find that 2% of these videos are cat videos. Determine which of the following is an observation, a variable, a sample statistic (value calculated based on the observed sample), or a population parameter.
  1. Percentage of all videos on YouTube that are cat videos.
  2. A video in your sample.
  3. Whether or not a video is a cat video.

7. Course satisfaction across sections.

A large college class has 160 students. All 160 students attend the lectures together, but the students are divided into 4 groups, each of 40 students, for lab sections administered by different teaching assistants. The professor wants to conduct a survey about how satisfied the students are with the course, and he believes that the lab section a student is in might affect the student’s overall satisfaction with the course.
  1. What type of study is this?
  2. Suggest a sampling strategy for carrying out this study.

8. Housing proposal across dorms.

On a large college campus first-year students and sophomores live in dorms located on the eastern part of the campus and juniors and seniors live in dorms located on the western part of the campus. Suppose you want to collect student opinions on a new housing structure the college administration is proposing and you want to make sure your survey equally represents opinions from students from all years.
  1. What type of study is this?
  2. Suggest a sampling strategy for carrying out this study.

9. Internet use and life expectancy.

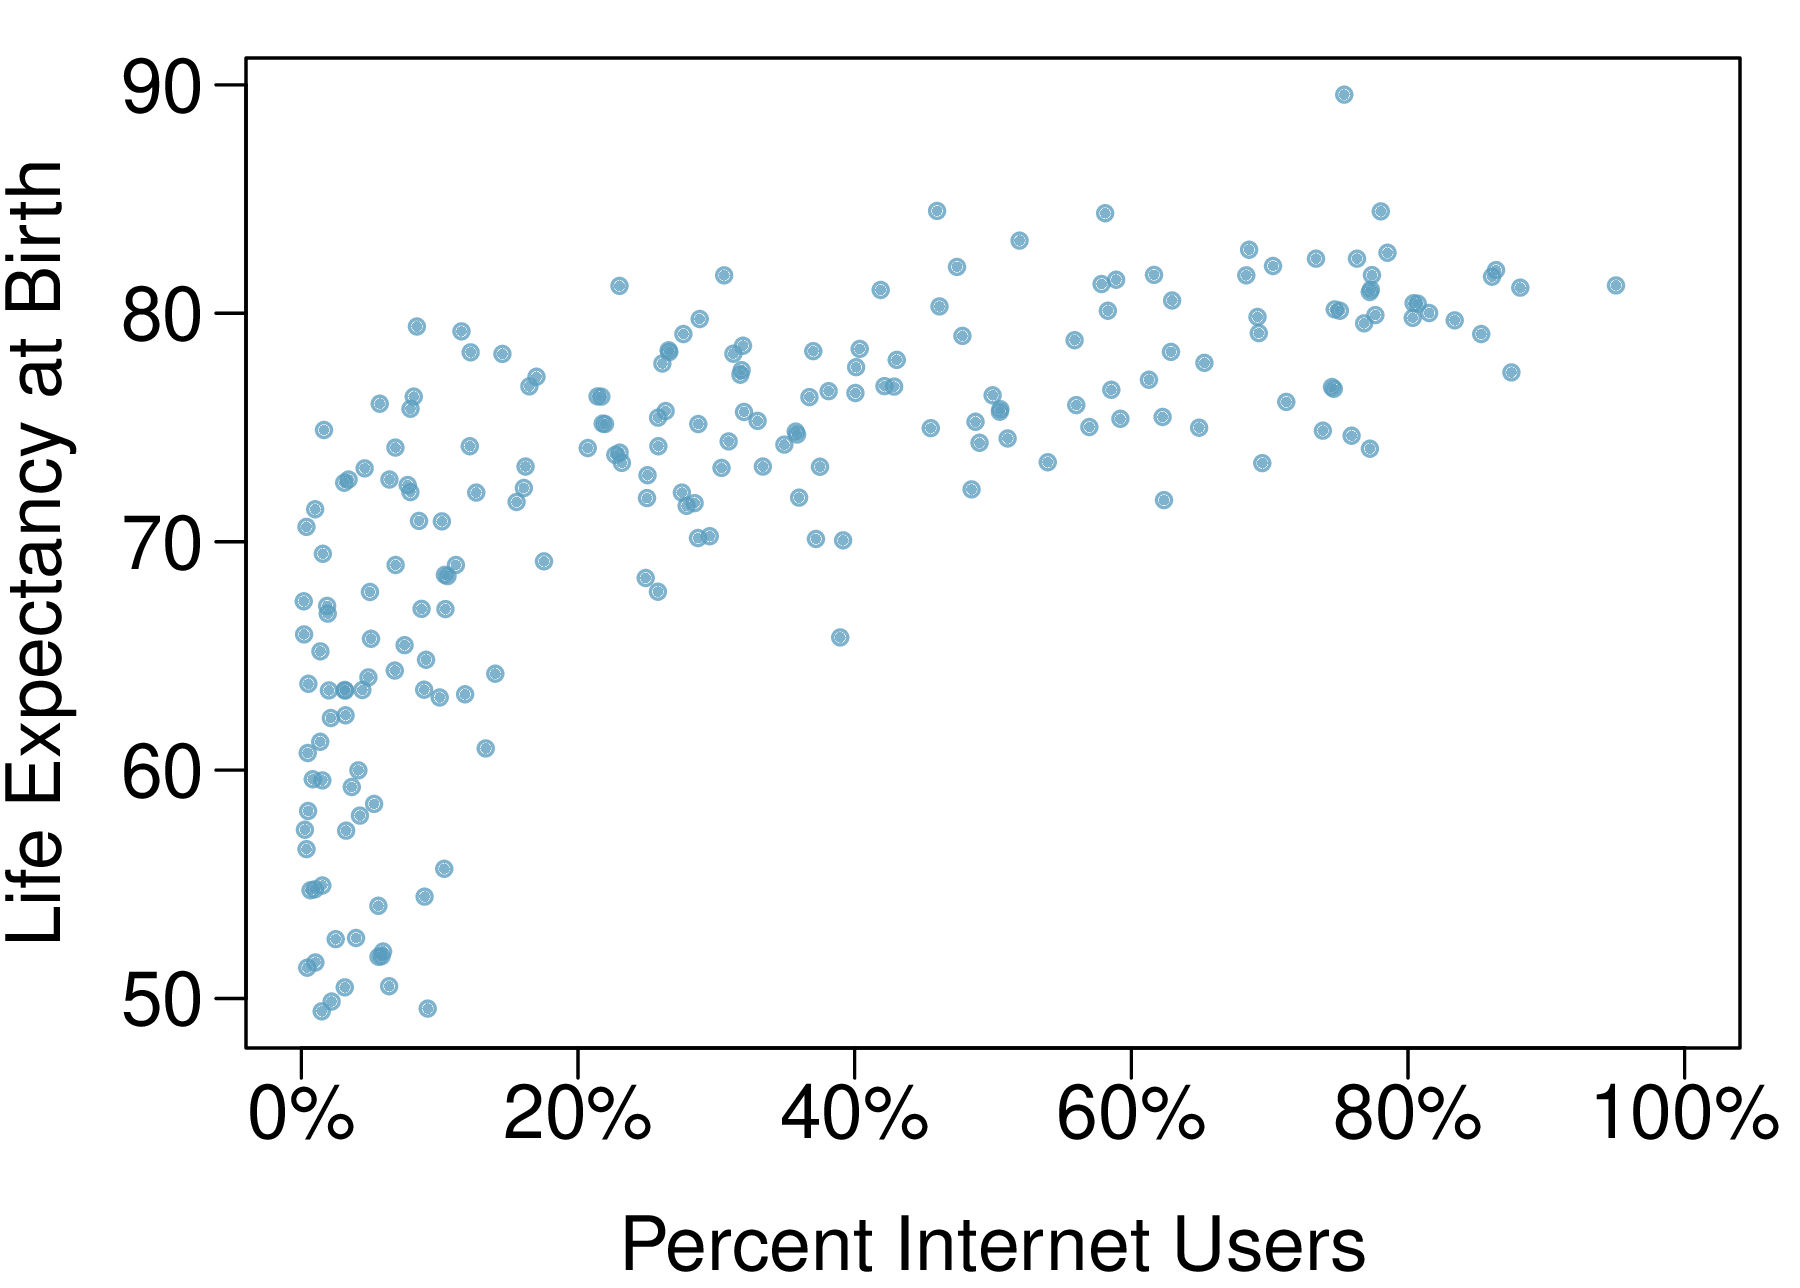
The following scatterplot was created as part of a study evaluating the relationship between estimated life expectancy at birth (as of 2014) and percentage of internet users (as of 2009) in 208 countries for which such data were available.
 2 
Citation: data:ciaFactbook
  1. Describe the relationship between life expectancy and percentage of internet users.
  2. What type of study is this?
  3. State a possible confounding variable that might explain this relationship and describe its potential effect.
Scatterplot with "percent of internet users" (0% to 100%) along the horizontal axis and "life expectancy at birth" (50 to 90) along the vertical axis. For 0% to 15%, about 100 points are evenly spread between 50 and 75. Then for 15% to 90%, the points are concentrated between about 70 and 85, and a slight upward trend is evident.

10. Stressed out, Part I.

A study that surveyed a random sample of otherwise healthy high school students found that they are more likely to get muscle cramps when they are stressed. The study also noted that students drink more coffee and sleep less when they are stressed.
  1. What type of study is this?
  2. Can this study be used to conclude a causal relationship between increased stress and muscle cramps?
  3. State possible confounding variables that might explain the observed relationship between increased stress and muscle cramps.

11. Evaluate sampling methods.

A university wants to determine what fraction of its undergraduate student body support a new \$25 annual fee to improve the student union. For each proposed method below, indicate whether the method is reasonable or not.
  1. Survey a simple random sample of 500 students.
  2. Stratify students by their field of study, then sample 10% of students from each stratum.
  3. Cluster students by their ages (e.g. 18 years old in one cluster, 19 years old in one cluster, etc.), then randomly sample three clusters and survey all students in those clusters.

12. Random digit dialing.

The Gallup Poll uses a procedure called random digit dialing, which creates phone numbers based on a list of all area codes in America in conjunction with the associated number of residential households in each area code. Give a possible reason the Gallup Poll chooses to use random digit dialing instead of picking phone numbers from the phone book.

13. Haters are gonna hate, study confirms.

A study published in the Journal of Personality and Social Psychology asked a group of 200 randomly sampled men and women to evaluate how they felt about various subjects, such as camping, health care, architecture, taxidermy, crossword puzzles, and Japan in order to measure their attitude towards mostly independent stimuli. Then, they presented the participants with information about a new product: a microwave oven. This microwave oven does not exist, but the participants didn’t know this, and were given three positive and three negative fake reviews. People who reacted positively to the subjects on the dispositional attitude measurement also tended to react positively to the microwave oven, and those who reacted negatively tended to react negatively to it. Researchers concluded that "some people tend to like things, whereas others tend to dislike things, and a more thorough understanding of this tendency will lead to a more thorough understanding of the psychology of attitudes."
 3 
Citation: Hepler:2013
  1. What are the cases?
  2. What is (are) the response variable(s) in this study?
  3. What is (are) the explanatory variable(s) in this study?
  4. Does the study employ random sampling?
  5. Is this an observational study or an experiment? Explain your reasoning.
  6. Can we establish a causal link between the explanatory and response variables?
  7. Can the results of the study be generalized to the population at large?

14. Family size.

Suppose we want to estimate household size, where a "household" is defined as people living together in the same dwelling, and sharing living accommodations. If we select students at random at an elementary school and ask them what their family size is, will this be a good measure of household size? Or will our average be biased? If so, will it overestimate or underestimate the true value?

15. Sampling strategies.

A statistics student who is curious about the relationship between the amount of time students spend on social networking sites and their performance at school decides to conduct a survey. Various research strategies for collecting data are described below. In each, name the sampling method proposed and any bias you might expect.
  1. He randomly samples 40 students from the study’s population, gives them the survey, asks them to fill it out and bring it back the next day.
  2. He gives out the survey only to his friends, making sure each one of them fills out the survey.
  3. He posts a link to an online survey on Facebook and asks his friends to fill out the survey.
  4. He randomly samples 5 classes and asks a random sample of students from those classes to fill out the survey.

16. Reading the paper.

Below are excerpts from two articles published in the NY Times:
  1. An article titled Risks: Smokers Found More Prone to Dementia states the following:
     4 
    Citation: news:smokingDementia
    "Researchers analyzed data from 23,123 health plan members who participated in a voluntary exam and health behavior survey from 1978 to 1985, when they were 50-60 years old. 23 years later, about 25% of the group had dementia, including 1,136 with Alzheimer’s disease and 416 with vascular dementia. After adjusting for other factors, the researchers concluded that pack-a-day smokers were 37% more likely than nonsmokers to develop dementia, and the risks went up with increased smoking; 44% for one to two packs a day; and twice the risk for more than two packs."
    Based on this study, can we conclude that smoking causes dementia later in life? Explain your reasoning.
  2. Another article titled The School Bully Is Sleepy states the following:
     5 
    Citation: news:bullySleep
    "The University of Michigan study, collected survey data from parents on each child’s sleep habits and asked both parents and teachers to assess behavioral concerns. About a third of the students studied were identified by parents or teachers as having problems with disruptive behavior or bullying. The researchers found that children who had behavioral issues and those who were identified as bullies were twice as likely to have shown symptoms of sleep disorders."
    A friend of yours who read the article says, "The study shows that sleep disorders lead to bullying in school children." Is this statement justified? If not, how best can you describe the conclusion that can be drawn from this study?