Section 1.3 From Non-Tidy --> Tidy
The reason it’s important to discuss what tidy data are an what they look like is because out in the world, most data are untidy. If you are not the one entering the data but are instead handed the data from someone else to do a project, more often than not, those data will be untidy. Untidy data are often referred to simply as messy data. In order to work with these data easily, you’ll have to get them into a tidy data format. This means you’ll have to fully recognize untidy data and understand how to get data into a tidy format.
The following common problems seen in messy datasets again come from Hadley Wickham’s paper on tidy data. After briefly reviewing what each common problem is, we will then take a look at a few messy datasets. We’ll finally touch on the concepts of tidying untidy data, but we won’t actually do any practice yet. That’s coming soon!
Subsection 1.3.1 Common problems with messy datasets
-
Column headers are values but should be variable names.
-
A single column has multiple variables.
-
Variables have been entered in both rows and columns.
-
Multiple "types" of data are in the same spreadsheet.
-
A single observation is stored across multiple spreadsheets.
Subsection 1.3.2 Examples of untidy data
To see some of these messy datasets, let’s explore three different sources of messy data.
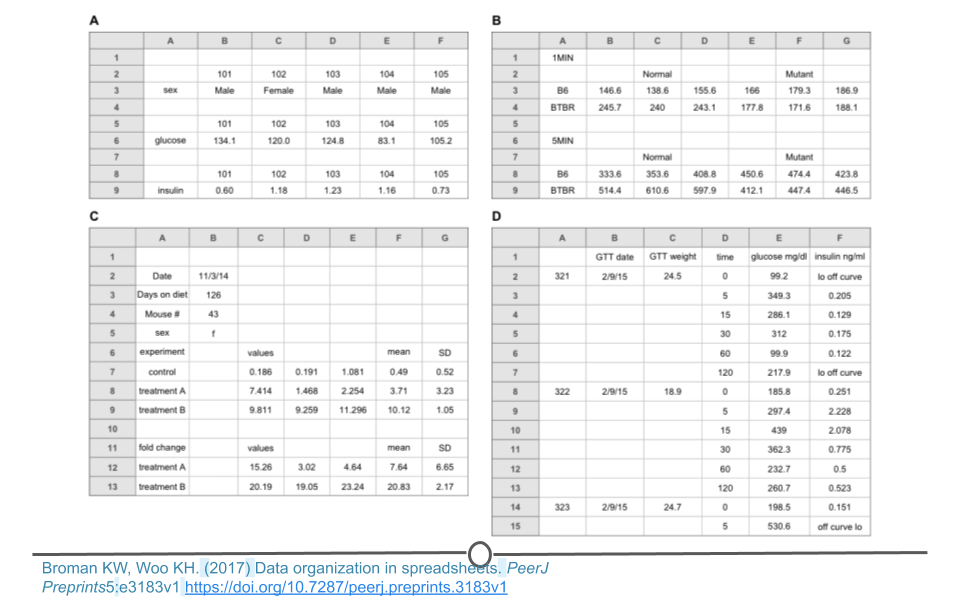
Subsubsection 1.3.2.1 Examples from Data Organization in Spreadsheets
In each of these examples, we see the principles of tidy data being broken. Each variable is not a unique column. There are empty cells all over the place. The data are not rectangular. Data formatted in these messy ways are likely to cause problems during analysis.
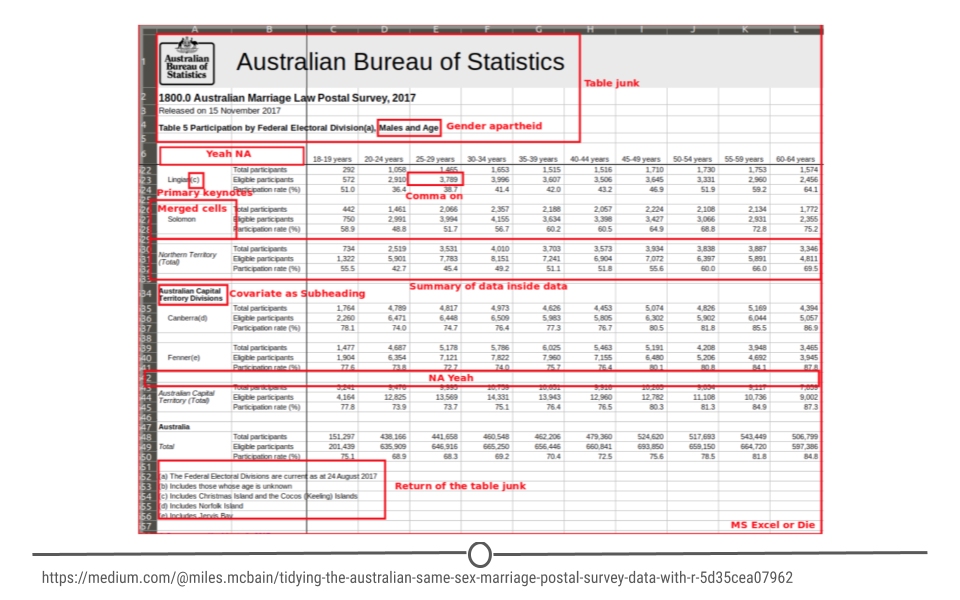
For a specific example, Miles McBain, a data scientist from Brisbane, Australia set out to analyze Australian survey data on Same Sex marriage. Before he could do the analysis, however, he had a lot of tidying to do. He annotated all the ways in which the data were untidy, including the use of commas in numerical data entry, blank cells, junk at the top of the spreadsheet, and merged cells. All of these would have stopped him from being able to analyze the data had he not taken the time to first tidy the data. Luckily, he wrote a Medium piece including all the steps he took to tidy the data.
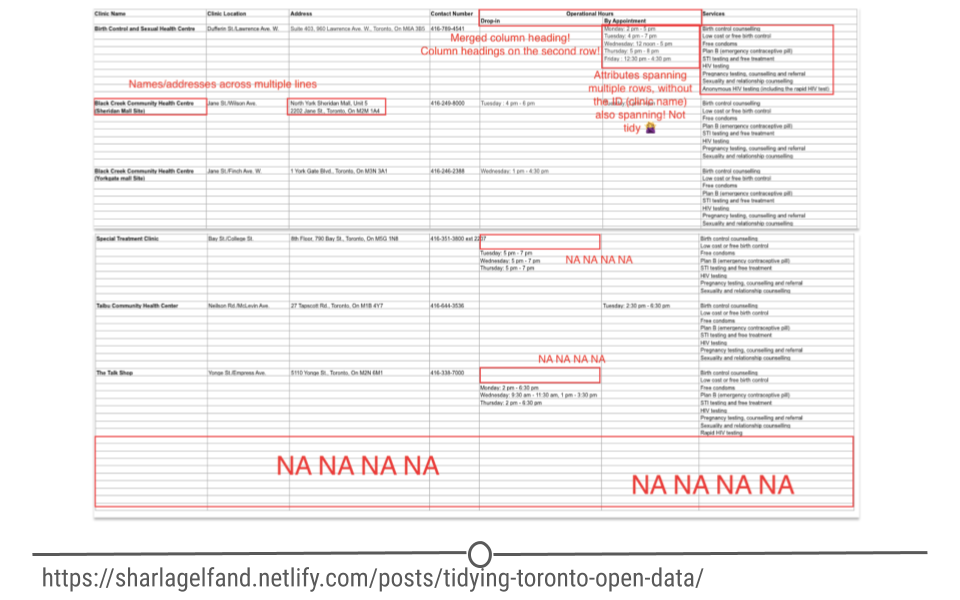
Inspired by Miles’ work, Sharla Gelfand decided to tackle a messy dataset from Toronto’s open data. She similarly outlined all the ways in which the data were messy including: names and addresses across multiple cells in the spreadsheet, merged column headings, and lots of blank cells. She has also included the details of how she cleaned these data in a blog post. While the details of the code may not make sense yet, it will shortly as you get more comfortable with the programming language, R.
Subsection 1.3.3 Tidying untidy data
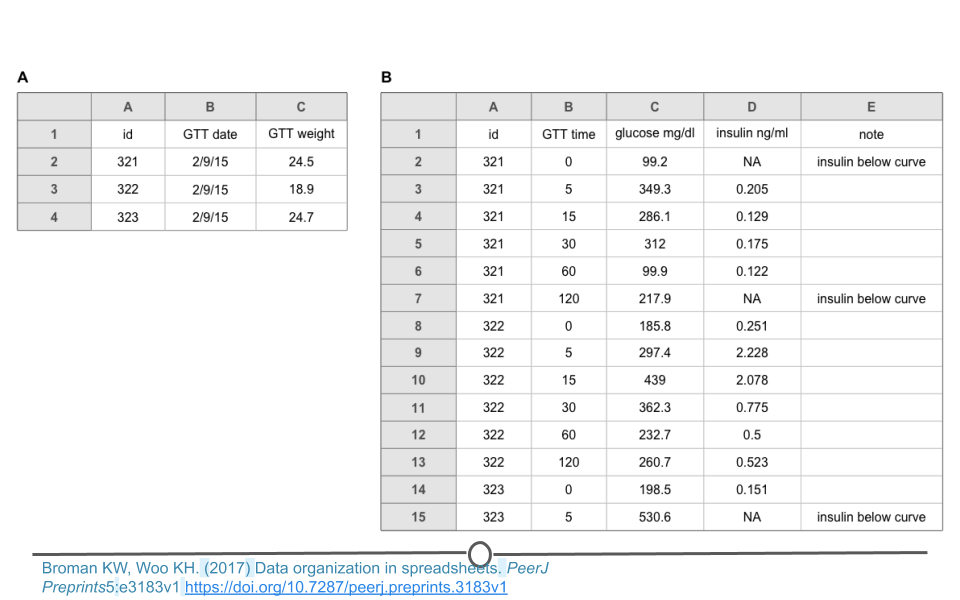
There are a number of actions you can take on a dataset to tidy the data depending on the problem. These include: filtering, transforming, modifying variables, aggregating the data, and sorting the order of the observations. There are functions to accomplish each of these actions in R. While we’ll get to the details of the code in a few lessons, it’s important at this point to be able to identify untidy data and to determine what needs to be done in order to get those data into a tidy format. Specifically, we will focus on a single messy dataset. This is dataset D from the ’Data Organization in Spreadsheets’ example of messy data provided above. We note that there are blank cells and that the data are not rectangular.
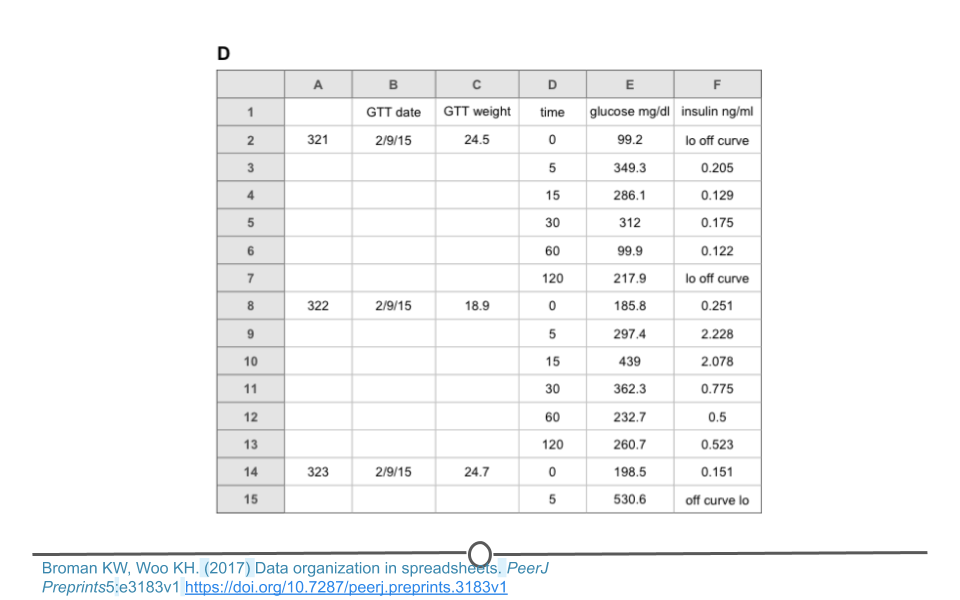
To address this, these data can be split into two different spreadsheets, one for each type of data. Spreadsheet A includes information about each sample. Spreadsheet B includes measurements for each sample over time. Note that both spreadsheets have an ’id’ column so that the data can be merged if necessary during analysis. The ’note’ column does have some missing data. Filling in these blank cells with ’NA’ would fully tidy these data. We note that sometimes a single spreadsheet becomes two spreadsheets during the tidying process. This is OK as long as there is a consistent variable name that links the two spreadsheets!