Section 5.12 Prediction Modeling
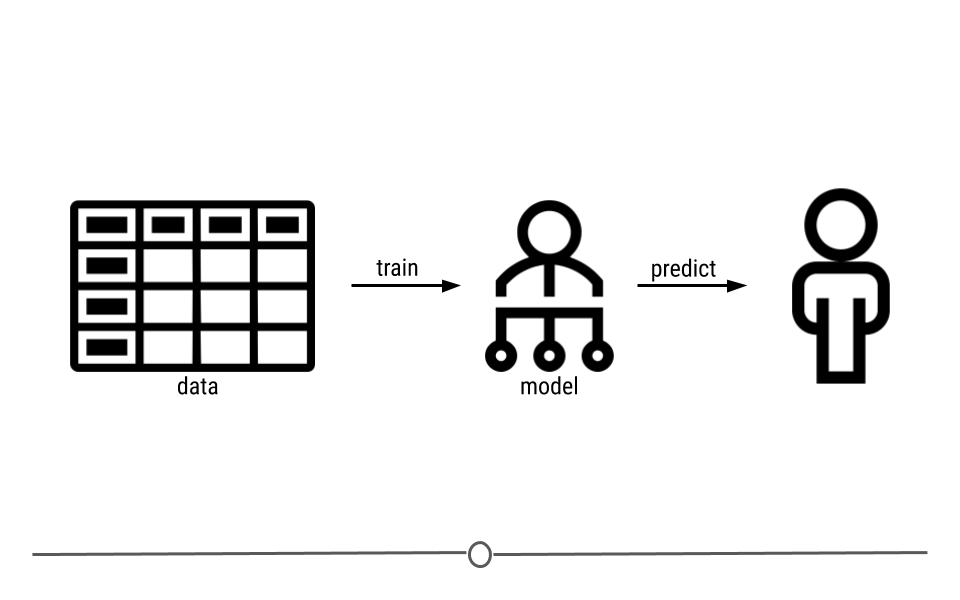
While the goal in inference is to learn something about the population, when we’re talking about prediction, the focus is on the individual. The goal of predictive analysis and machine learning approaches is to train a model using data to make predictions about an individual.
In other words, the goal of predictive analysis is to use data you have now to make predictions about future data.
We spend a lot of time trying to predict things in daily life- the upcoming weather, the outcomes of sports events, and the outcomes of elections. Using historical polling data and trends and current polling, Nate Silver’s FiveThirtyEight builds models to predict the outcomes and the next US Presidential vote - and has been fairly accurate at doing so! FiveThirtyEight’s models accurately predicted the 2008 and 2012 elections and was widely considered an outlier in the 2016 US elections, as it was one of the few models to suggest Donald Trump had a chance of winning.
Predicting the outcome of elections is a key example of predictive analysis, where historical data (data they have now) are used to predict something about the future.
Subsection 5.12.1 What is Machine Learning?
So far we’ve been discussing predictive analysis. But, you may have heard people on the news or in daily life talking about "machine learning." The goal of machine learning in prediction is to build models (often referred to as algorithms) from the patterns in data that can be used for predictions in the future. Here, machine learning refers to using the relationships within a dataset to build a model that can be used for prediction.
That said, there is without a doubt an entire field of individuals dedicating themselves to machine learning. This lesson will just touch on the very basics within the field.
Subsection 5.12.2 Machine Learning Steps
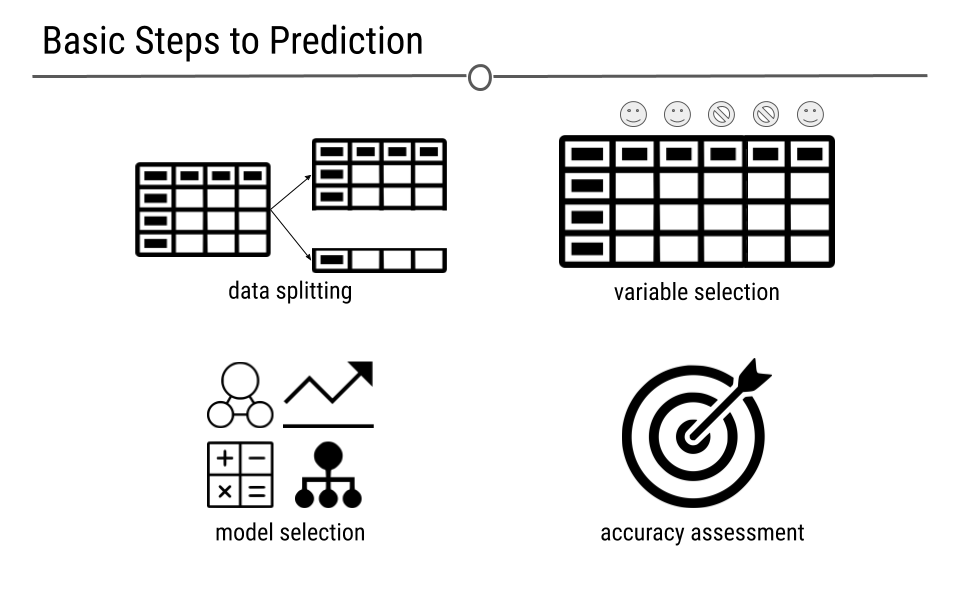
In order to make predictions for the future using data you have now, there are four general steps:
-
Data Splitting - what data are you going to use to train your model? To tune your model? To test your model?
-
Variable Selection - what variable(s) from the data you have now are you going to use to predict future outcomes?
-
Model Selection - How are you going to model the data?
-
Accuracy Assessment - How are you going to assess accuracy of your predictions?
Subsection 5.12.3 Data Splitting
For predictive analysis (or machine learning), you need data on which to train your model. These are the set of observations and corresponding variables that you’re going to use to build your predictive model. But, a predictive model is only worth something if in can predict accurately in a future dataset. Thus, often, in machine learning there are three datasets used to build a predictive model. The names for these datasets vary to some degree.
Subsection 5.12.4 Train, Test, Validate
Many people use train, validate, and test. However, almost as many people use train, test, and validate, as evidenced by this Twitter poll:
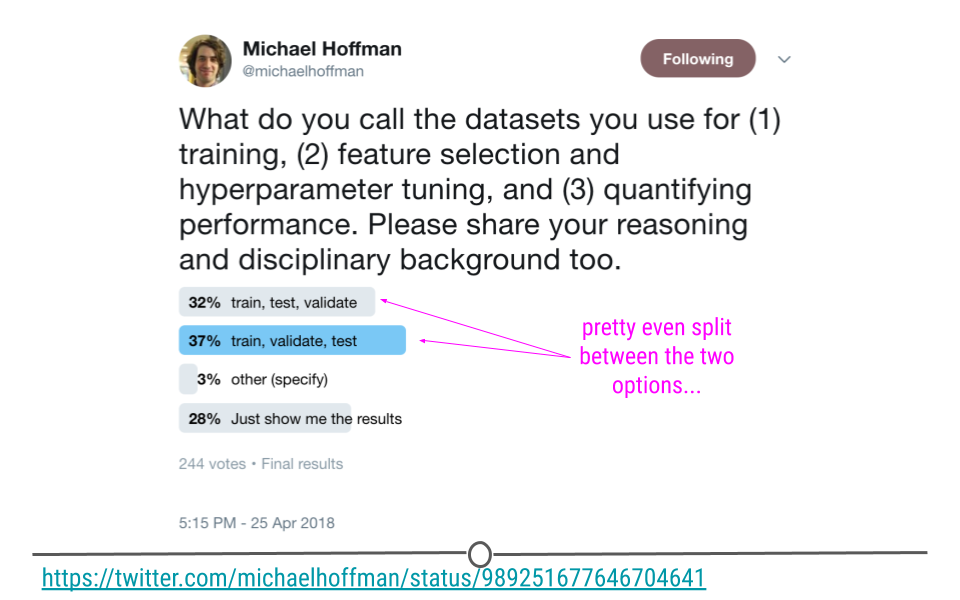
In this lesson, we’ve decided to go with the terminology that fits the tidymodels terminology: train, test, validate.
Subsection 5.12.5 Train
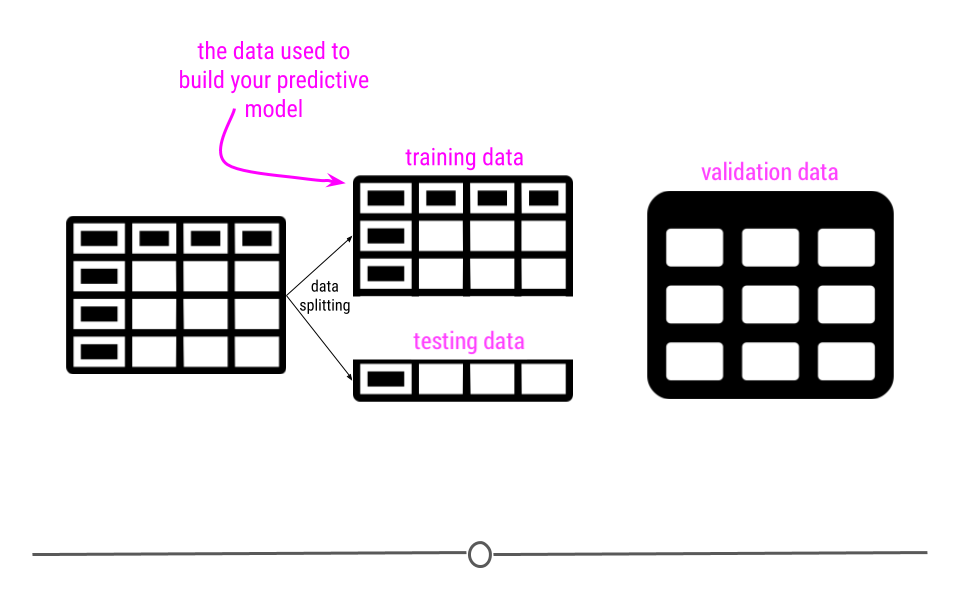
Training data are the data we described above. It is the data used to build your predictive model. These data are referred to as your training set.
Subsection 5.12.6 Test
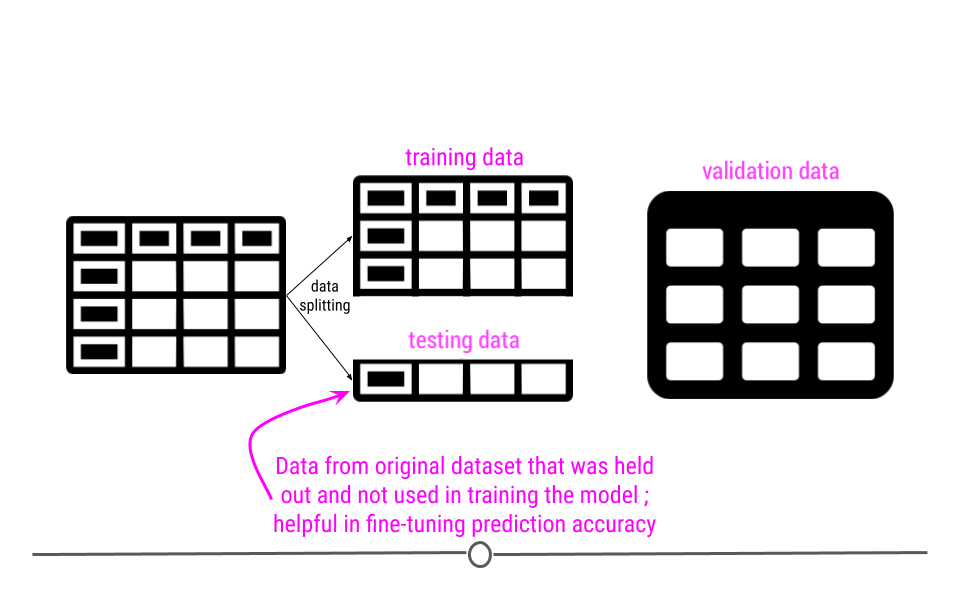
Before getting started, your original dataset is often split. Some (often 70%-75%) of the observations in your dataset are used to train the model, while 25%-30% are held out.
These hold-out samples are used to see whether or not your predictive model accurately makes predictions in the set of samples not used to train the model.
Subsection 5.12.7 Validate
Finally, an independent dataset -- one that is not from the same experiment or source as the data used to train and test your model are used to see whether or not your predictive model makes accurate predictions in a completely new dataset. Predictive models that can be generalized to and make accurate predictions in new datasets are the best predictive models.
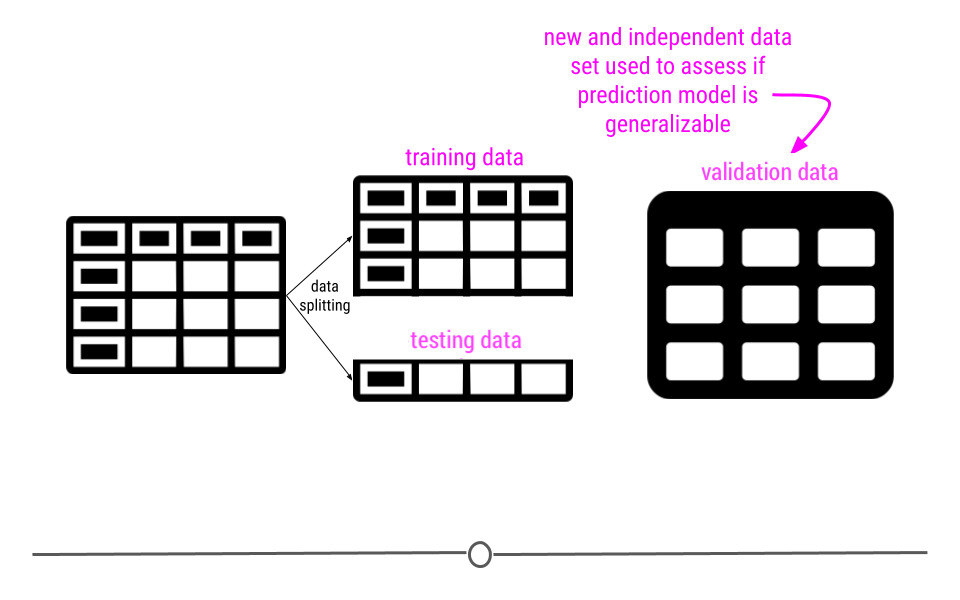
Ultimately, we want to create a model that will perform well with any new data that we try to use. In other words we want the model to be generalizable so we can use it again to make predictions with new data. We don’t want the model to only work well with the data that we used to train the model (this is called overfitting). Using a validation set helps us to assess how well our model might work with new data in the future. This is part of what we call out-of-sample testing, as we evaluate the performance of the model on independent data that was not a part of the sample used to train the model.
Subsection 5.12.8 Variable Selection
For predictive analysis to be worth anything, you have to be able to predict an outcome accurately with the data you have on hand.
If all the data you have on hand are the heights of elephants in Asia, you’re likely not going to be able to predict the outcome of the next US election. Thus, the variables in the data you have on hand have to be related to the outcome you’re interested in predicting in some way (which is not the case for the heights of elephants and US elections).
Instead, to predict US elections, you’d likely want some data on outcomes of previous elections, maybe some demographic information about the voting districts, and maybe some information about the ages or professions of the people voting. All of these variables are likely to be helpful in predicting the outcome in a future election, but which ones are actually predictive? All of them? Some of them? The process of deciding which variables to use for prediction is called variable selection.
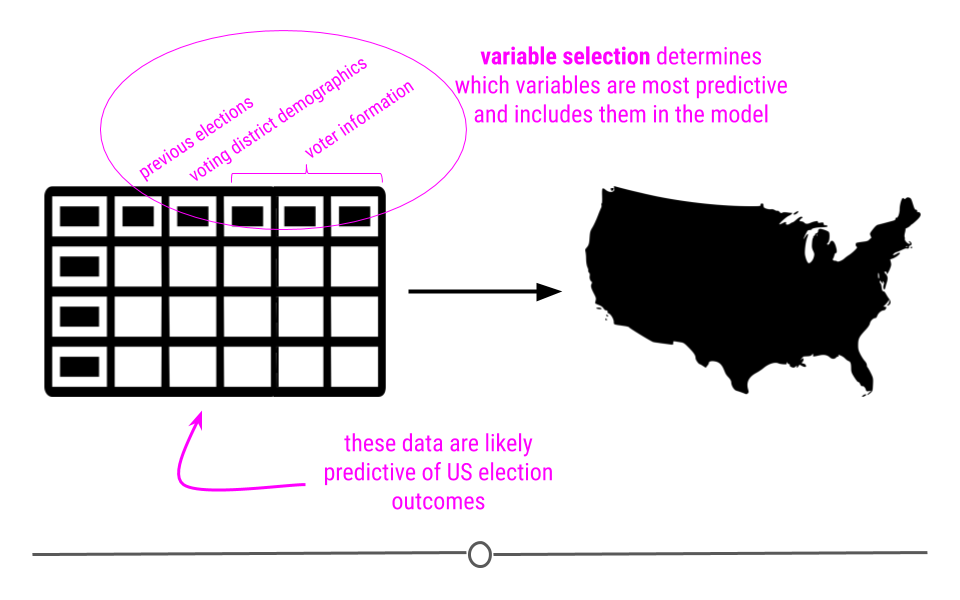
You ideally want to include the fewest variables in your model as possible. Only having a few variables in your model avoids you having to collect a ton of data or build a really complicated model. But, you want the model to be as accurate as possible in making predictions. Thus, there’s always a balance between minimizing the variables included (to only include the most predictive variables!) and maximizing your model’s predictive accuracy. In other words, like in inferential analysis, your ability to make accurate predictions is dependent on whether or not you have measurements on the right variables. If you aren’t measuring the right variables to predict an outcome, your predictions aren’t going to be accurate. Thus, variable selection, is incredibly important.
All that said, there are machine learning approaches that carry out variable selection for you, using all the data to determine which variables in the dataset are most helpful for prediction. Nevertheless, whether you are deciding on the variables to include or the computer is deciding for you, variable selection is important to accurate prediction.
Subsubsection 5.12.8.1 Lack of Causality Reminder
As a reminder, as was discussed in the inferential analysis, just because one variable may predict another, it does not mean that one causes the other. In predictive analysis, you are taking advantage of the relationship between two variables, using one variable (or one set of variables) to predict a second variable. Just because one variable accurately predicts another variable does not mean that they are causally related.
Subsection 5.12.9 Model Selection
Additionally, there are many ways to generate prediction models. Each model was developed for a different and specific purpose. However, regardless of which model you choose to use for prediction, it’s best to keep in mind that, in general, the more data you have and the simpler your model is, the best chance you have at accurately predicting future outcomes:
-
More data - The more observations you have and the more variables you have to choose from to include in your model, the more likely you are to generate an accurate predictive model. Note, however, large datasets with lots of missing data or data that have been incorrectly entered are not better than small, complete, and accurate datasets. Having a trustworthy dataset to build your model is critical.
-
Simple Models - If you can accurately predict an individual’s height by only considering that person’s parents height, then go for it. There’s no need to include other variables if a single variable generates accurate predictions. A simple model that predicts accurately (regardless of the dataset in which you’re predicting) is better than a complicated model.
Subsection 5.12.10 Regression vs. Classification
Before we jump into discussing the various models you can use for predictive analysis, it’s important to first note the difference between regression and classification. Regression is used when you’re trying to predict a continuous variable. For example if you’re trying to predict an individual’s age, you would use regression. On the other hand, classification is used for categorical variables, as it predicts which group an individual belongs to. An example of a classification would be predicting someone’s education level, as there are only a limited number of groups into which one would be.
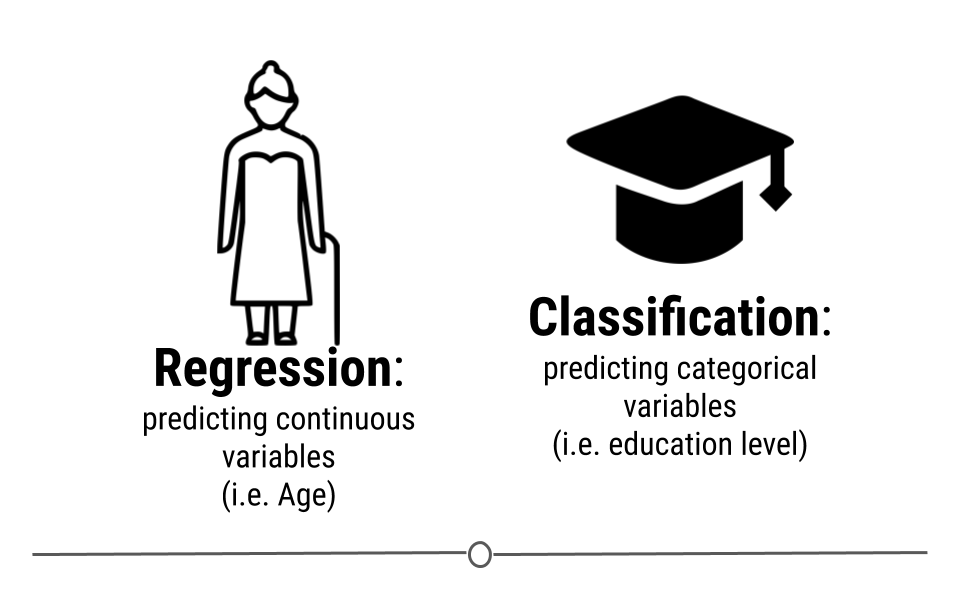
With regards to machine learning, certain methods can be used for both regression and classification, while others are designed exclusively for one or the other.
In this lesson we’ll discuss one regression model and one classification model. However, there are literally hundreds of models available for predictive modeling. Thus, it’s important to keep in mind that we’re really just scratching the surface here.
Subsubsection 5.12.10.1 Linear Regression
Just like in the previous lesson in inferential analysis, linear regression is an incredibly powerful method in machine learning! The concept here is the same as it was in the last lesson: we’re going to capitalize on the linear relationship between variables. However, instead of using linear regression to estimate something about a larger population, we’re going to use linear regression for prediction of a continuous variable.
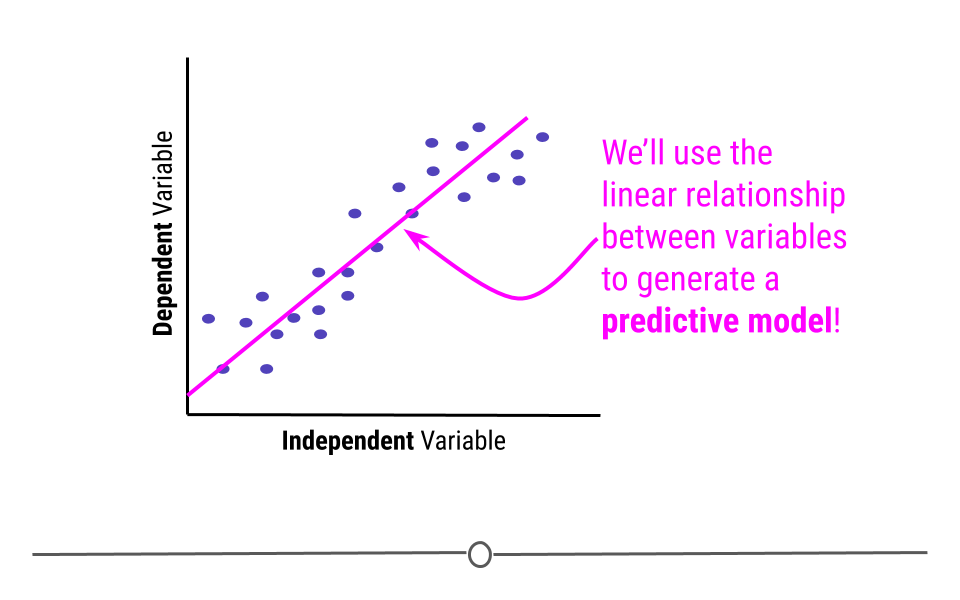
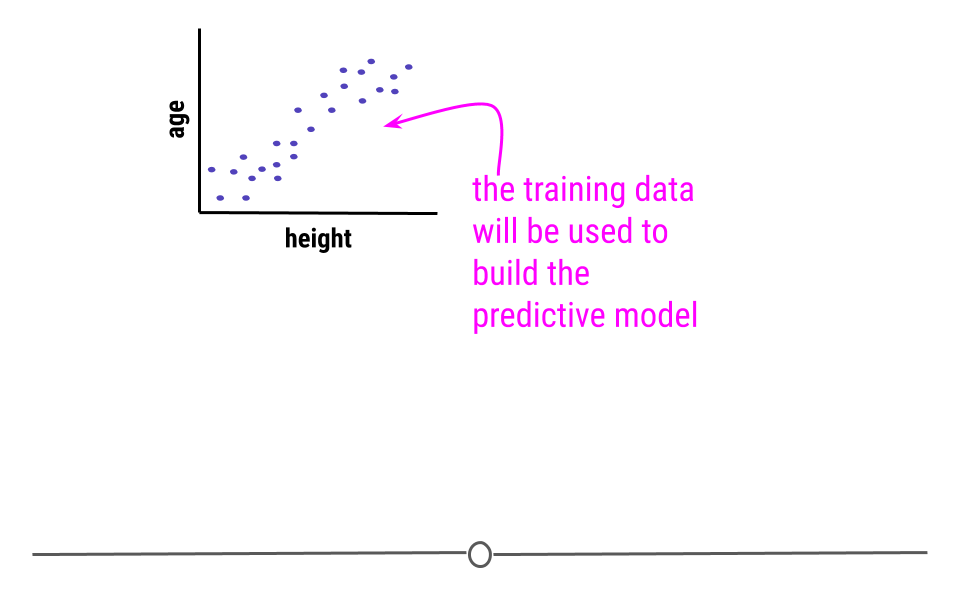
To better understand this, let’s use a conceptual example. Consider trying to predict a child’s age from their height. You’d likely expect that a taller child was older. So, let’s imagine that we’re looking here at the training data. We see the expected relationship between height and age in this scatterplot.
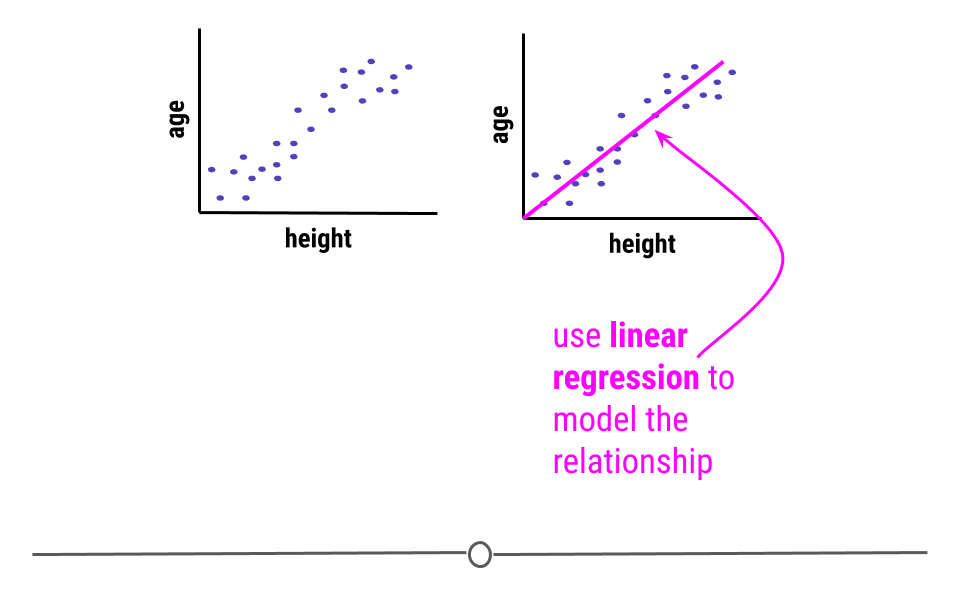
Using the training data, linear regression is then carried out to model the relationship.
Now that we have our model, we no longer care about the individual data points in the training data. We’ll simply use the linear regression model to make our predictions.
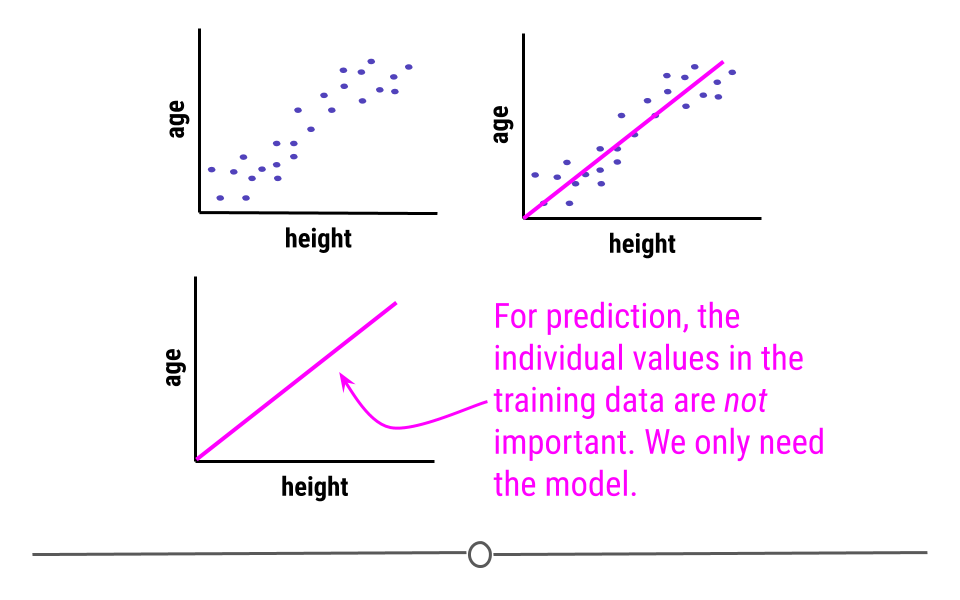
Then, in the future when we know a child’s height, we can return to our linear regression, supply it with the new child’s height and it will return the child’s age using the model we’ve built.
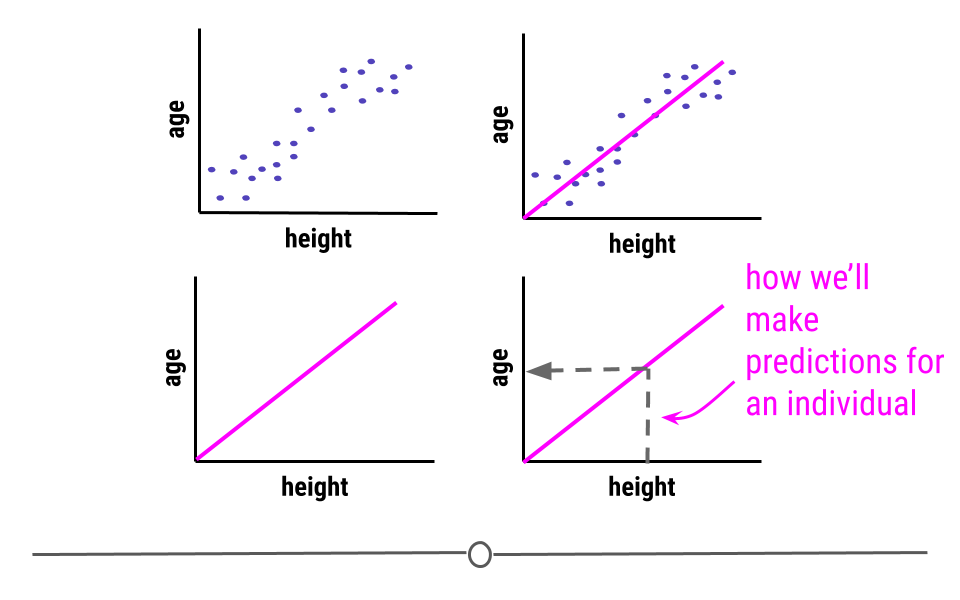
Conceptually, this is what will happen whenever we use linear regression for machine learning. However, it will be carried out mathematically, rather than graphically. This means you won’t have to look on the graph to see your predictions. You’ll just have to run a few lines of code that will carry out the necessary calculations to generate predictions.
Additionally, here we’re using a single variable (height) to model age. Clearly, there are other variables (such as a child’s sex) that could affect this prediction. Often, regression models will include multiple predictor variables that will improve prediction accuracy of the outcome variable.
Subsubsection 5.12.10.2 Classification and Regression Trees (CART)
Alternatively, when trying to predict a categorical variable, you’ll want to look at classification methods, rather than regression (which is for continuous variables). In these cases you may consider using a classification and regression tree (CART) for prediction. While not the only classification method for machine learning, CARTs are a basic and commonly-used approach to prediction for categorical variables.
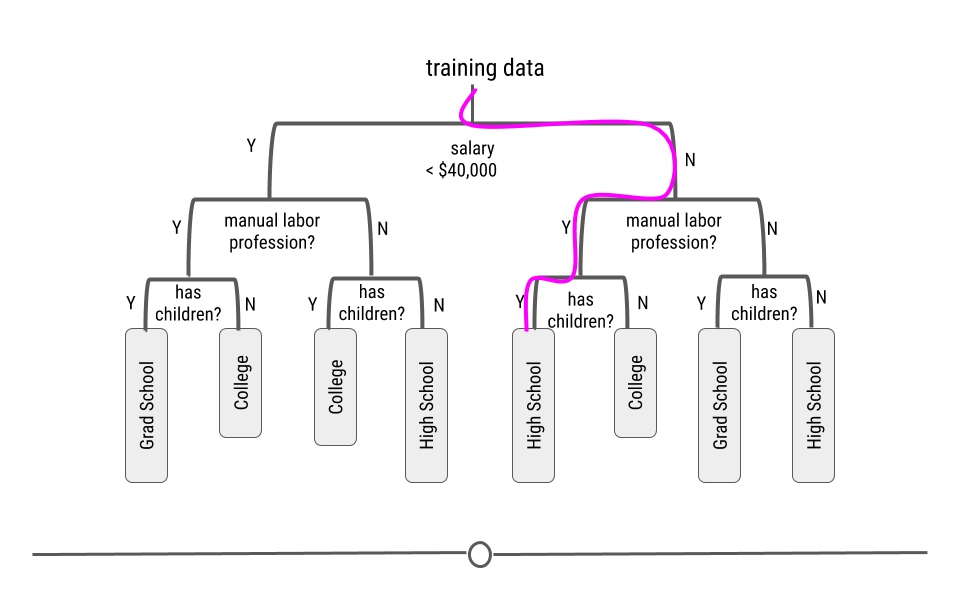
Conceptually, when using a CART for prediction, a decision tree is generated from the training data. A decision tree branches the data based on variables within the data. For example, if we were trying to predict an individual’s education level, we would likely use a dataset with information about many different people’s income level, job title, and the number of children they have. These variables would then be used to generate the tree.
For example, maybe the first branch would separate individuals who make less than 40,000 dollars a year. All of those in the training data who made less than 40K would go down the left-hand branch, while everyone else would go down the right-hand branch.
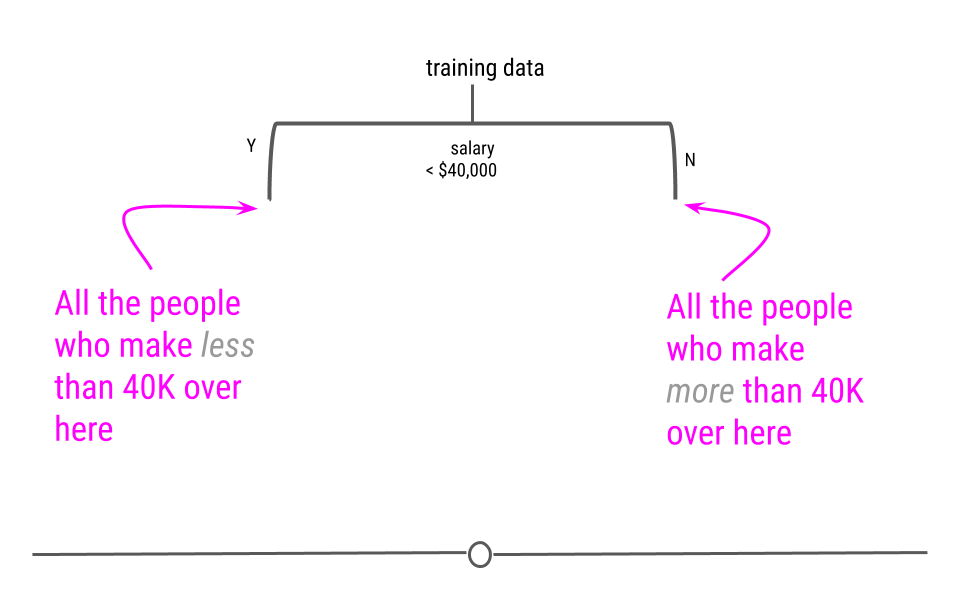
At each level, the data will continue to be split, using the information in the training data.
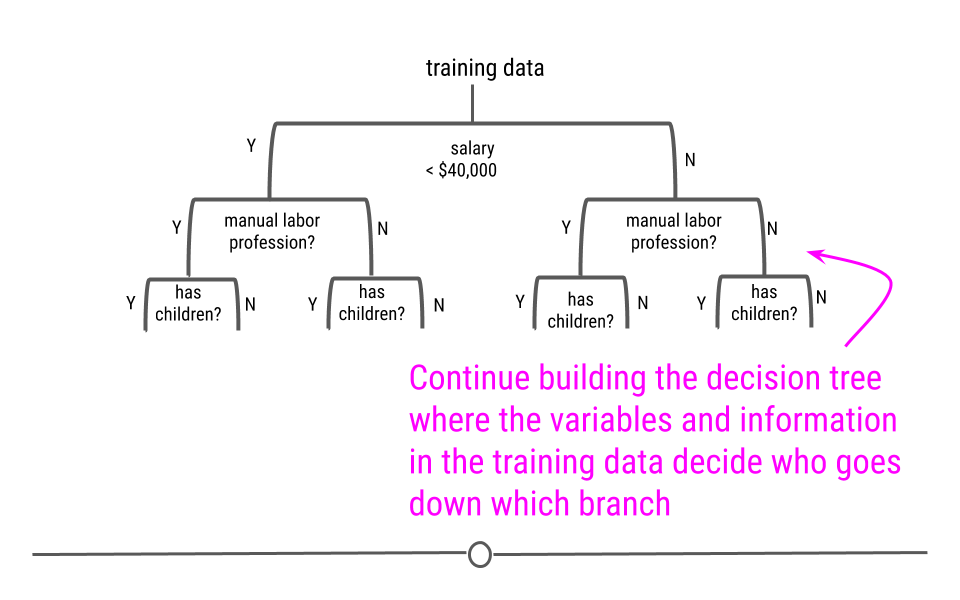
Finally, a full decision tree will be constructed, such that there will be a label for the variable we’re trying to predict at the end of each branch.
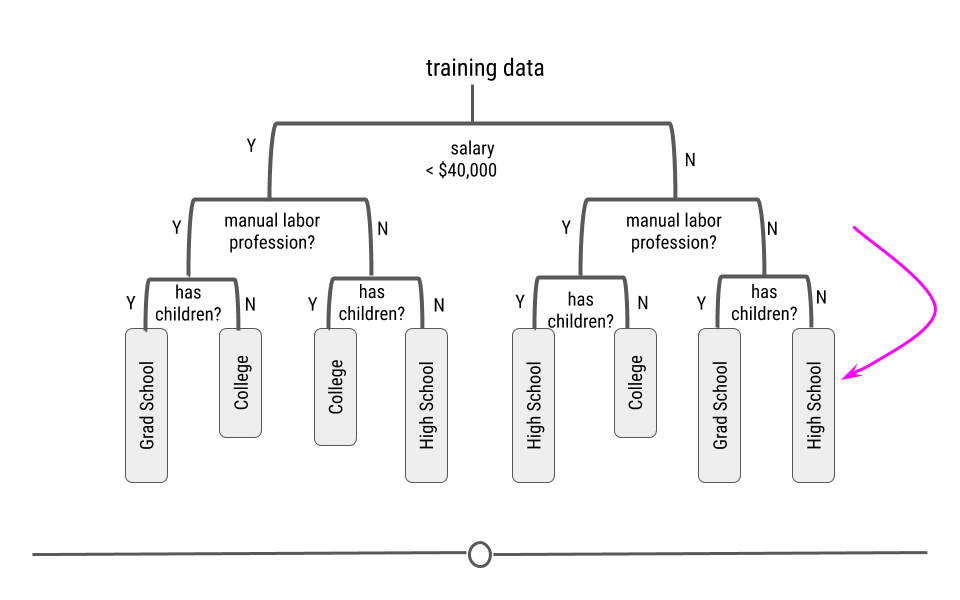
This CART will then be used for prediction in future samples. Thus, if you follow the path along the decision tree, for this example CART, an individual who made more than $40,000 a year, was in a manual labor profession, and had children, this CART would predict that that individual’s education level was "High School."
Again, this is conceptually and graphically how a CART works; however, when generating a CART yourself, it again only takes a few lines of code to generate the model and carry out the necessary math.
Subsection 5.12.11 Model Accuracy
A common saying is that prediction is hard, especially about the future. This is true in predictive analysis. Thus, it’s important to always carefully evaluate the accuracy of your model and to never overstate how well you are able to make predictions.
Generally, if your predictions are correct, you’re doing well! If your predictions are wrong, you’re not doing as well. But, how do we define "well"?
Subsubsection 5.12.11.1 Error Rates
To assess whether or not our predictive models are doing well, we calculate error rates. There are metrics used to measure model performance, however, the two most common ways to assess how well our predictive models are doing are:
-
RMSE (Root-mean-square Error)
-
Accuracy
We’ll note here that in order to assess error, you have to know the truth (the actual value) in addition to the predicted value. Thus, RMSE and accuracy are assessed in the training and tuning data, where you know the actual value as well as the predicted value.
Subsubsection RMSE
The root-mean-square error (RMSE) is a measure used to assess prediction error for continuous variables. Generally, we want to minimize error in prediction. Thus, a small RMSE is better than a large RMSE.
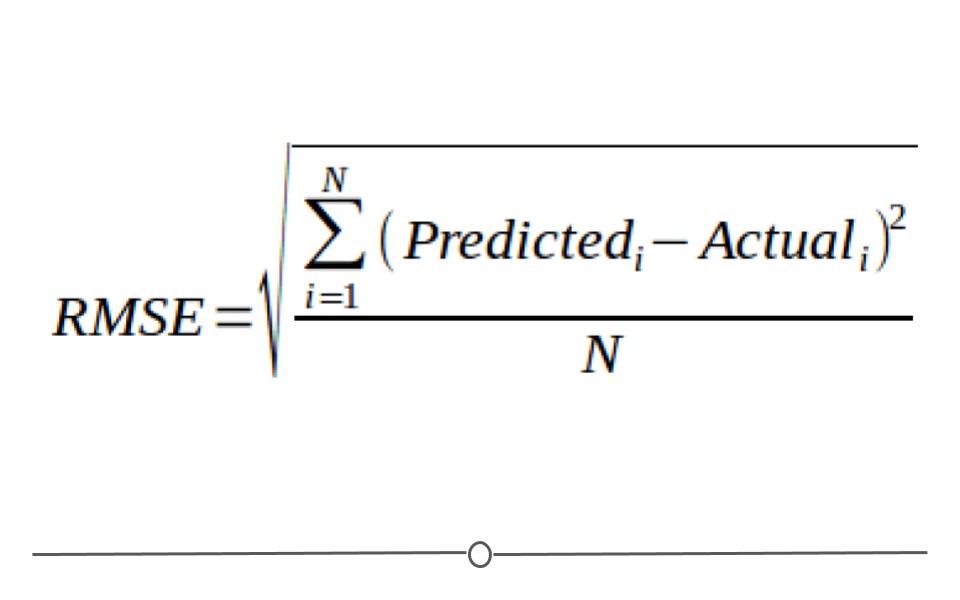
Mathematically speaking, the RMSE is the square root of the variance. From earlier, we know that variance has something to do with how confident we are in our estimate. Since we’re trying to determine how close our predictions are to the actual value, this seems like a good place to start.
When we look at the equation, we can see that the difference between the predicted and actual values is calculated
(Predicted - Actual) and that this value is then squared (Predicted - Actual)^2. These differences squared are then added for every individual in your dataset (that’s what the sigma, or big E says). This value (the sum of all the errors squared) is then divided by the number of individuals in your dataset (N). This square root of this value is then taken. This is how RMSE is calculated.
We went through that description because we want to point out that when differences are squared
(Predicted - Actual)^2, outliers, or samples whose prediction was far off from their actual value are going to increase the RMSE a lot. Thus, a few outliers can lead to really high RMSE values, even if all the other predictions were pretty good. This means it’s important to check to see if a few outliers (meaning a few bad predictions) are leading to a high RMSE value.
Subsubsection 5.12.11.2 Accuracy
Alternatively, to assess error in the prediction of categorical variables, accuracy is frequently used. Accuracy looks to determine the number of predictions that match their actual values.
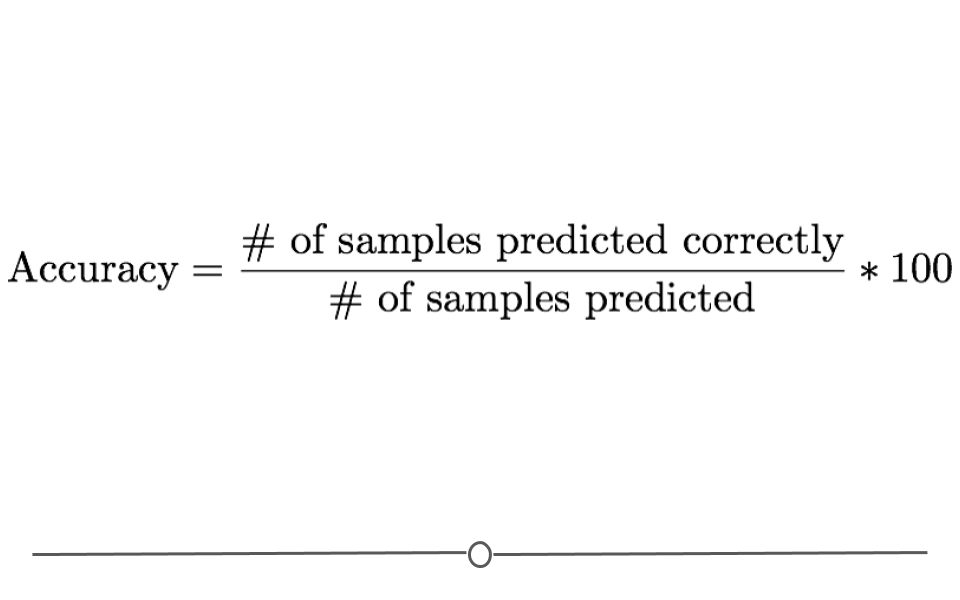
The closer this value is to 100%, the better your predictive model was. The closer to 0%, the worse your model’s predictions are.
Accuracy is a helpful way to assess error in categorical variables, but it can be used for numeric values too. However, it will only account a prediction "correct" if it matches exactly. In the case of age, if a sample’s age is 10 and the model predicts it to be 10, the model will say it’s been predicted correctly. However, if a sample’s age is 10 and it is predicted to be 9, it will be counted as incorrect, even though it was close. A prediction off by a year will be marked just as incorrect as a sample predicted off by 50 years. Due to this, RMSE is often opted for instead of accuracy for continuous variables.
It is also important to realize that having low RMSE or high accuracy with your training does not necessarily indicate that your model is generalizable. It indicates that your model works well with your training data. However if your model fits your training data too well it may not be very good at predicting with new data. This is why we have a subset of the original data to use to test our model.

