Section 1.4 The Data Science Life Cycle
Now that we have an understanding of what tidy data are, it’s important to put them in context of the data science life cycle. We mentioned this briefly earlier, but the data science life cycle starts with a question and then uses data to answer that question. The focus of this specialization is mastering all the steps in between formulating a question and finding an answer. There have been a number of charts that have been designed to capture what these in-between steps are.
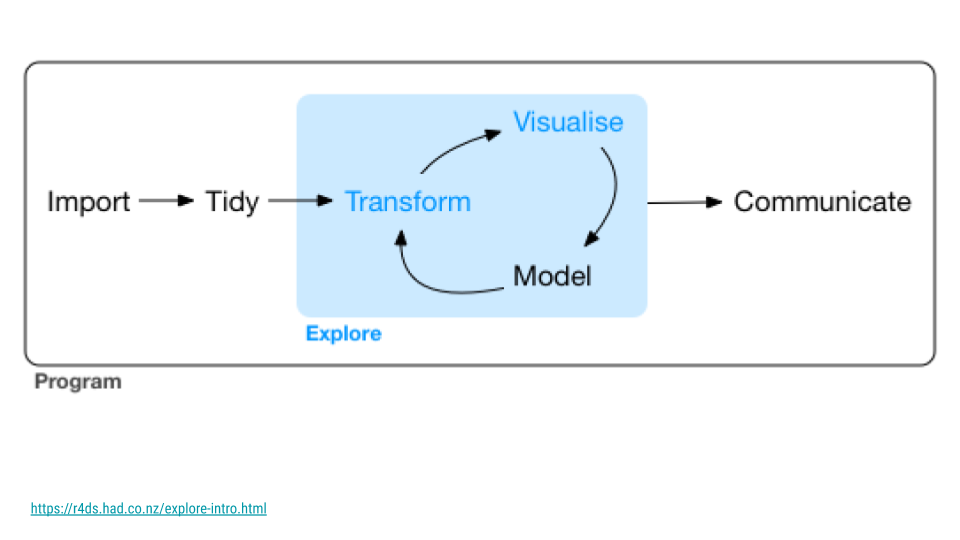
The most famous is likely this version from R for Data Science. This version highlights import and tidying as important steps in the pipeline. It also captures the fact that visualization, data transformation, and modeling are often an iterative process before one can arrive at an answer to their question of interest.
Others have set out to design charts to explain all the steps in between asking and answering question. They are all similar but have different aspects of the process they highlight and/or on which they focus. These have been summarized in A First Course on Data Science.
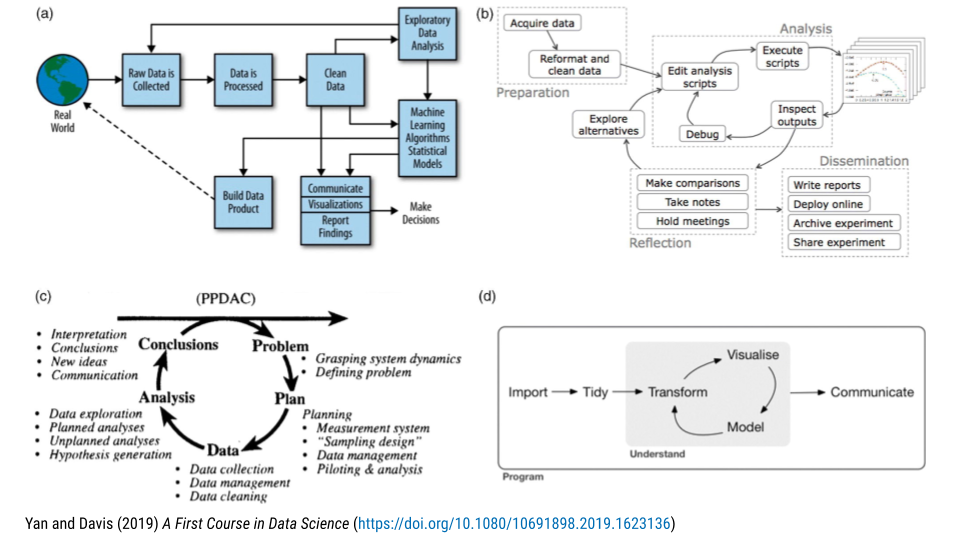
Regardless of which life cycle chart you like best, when it comes down to answering a data science question, importing, tidying, visualizing, and analyzing the data are important parts of the process. It’s these four parts of the pipeline that we’ll cover throughout this specialization.

