Section 1.2 Tidy Data
Before we can discuss all the ways in which R makes it easy to work with tidy data, we have to first be sure we know what tidy data are. Tidy datasets, by design, are easier to manipulate, model, and visualize because the tidy data principles that we’ll discuss in this course impose a general framework and a consistent set of rules on data. In fact, a well-known quote from Hadley Wickham is that "tidy datasets are all alike but every messy dataset is messy in its own way." Utilizing a consistent tidy data format allows for tools to be built that work well within this framework, ultimately simplifying the data wrangling, visualization, and analysis processes. By starting with data that are already in a tidy format or by spending the time at the beginning of a project to get data into a tidy format, the remaining steps of your data science project will be easier.
Subsection 1.2.1 Data Terminology
Before we move on, let’s discuss what is meant by dataset, observations, variables, and types, all of which are used to explain the principles of tidy data.
Dataset
A dataset is a collection of values. These are often numbers and strings, and are stored in a variety of ways. However, every value in a dataset belongs to a variable and an observation.
Variables
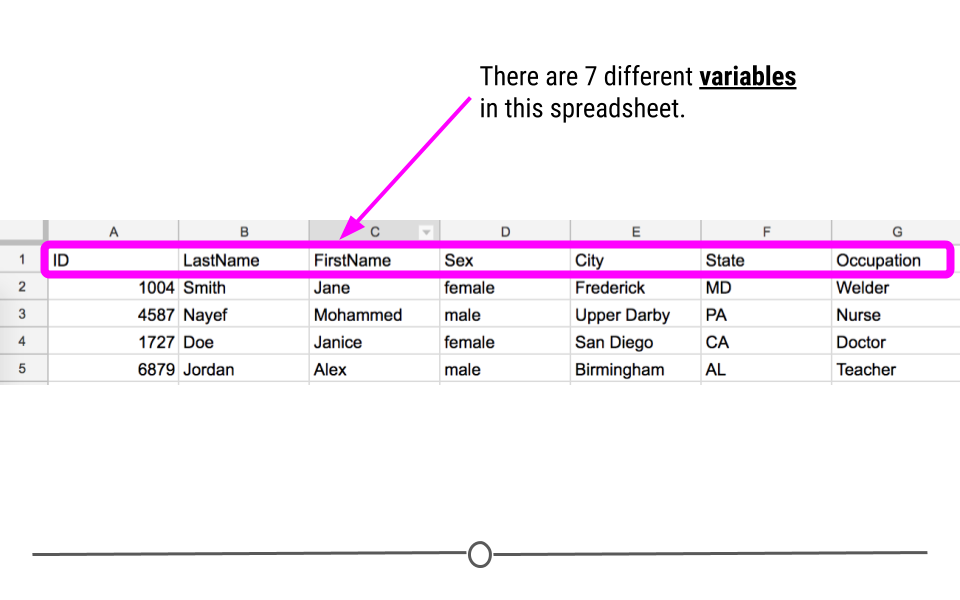
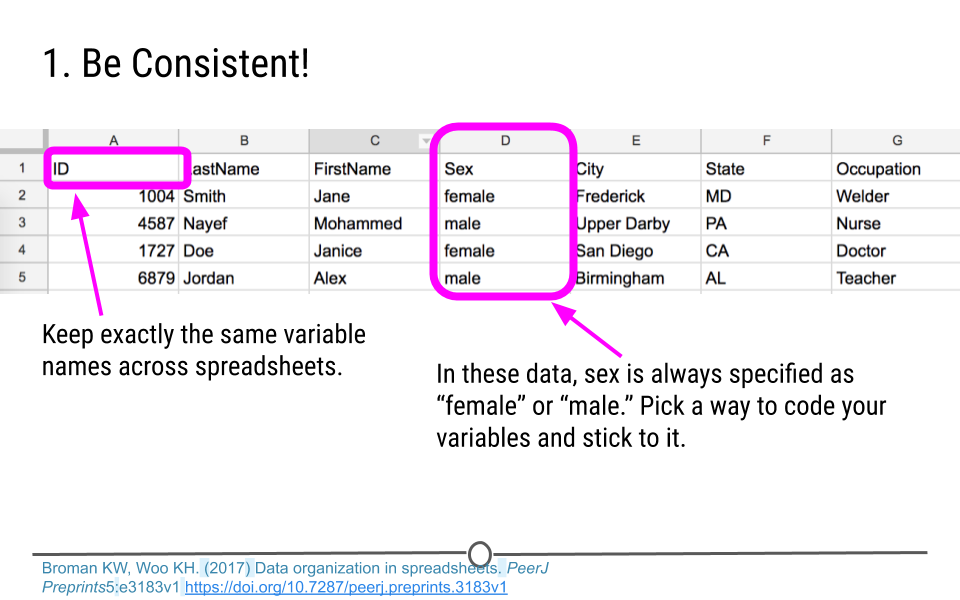
Variables in a dataset are the different categories of data that will be collected. They are the different pieces of information that can be collected or measured on each observation. Here, we see there are 7 different variables: ID, LastName, FirstName, Sex, City, State, and Occupation. The names for variables are put in the first row of the spreadsheet.
Observations
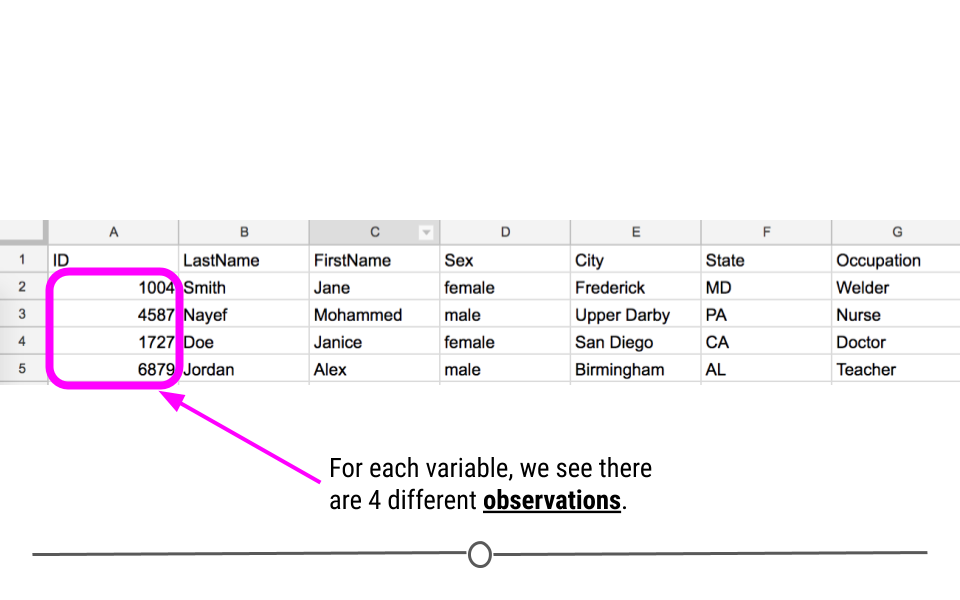
The measurements taken from a person for each variable are called observations. Observations in a tidy dataset are stored in a single row, with each observation being put in the appropriate column for each variable.
Types
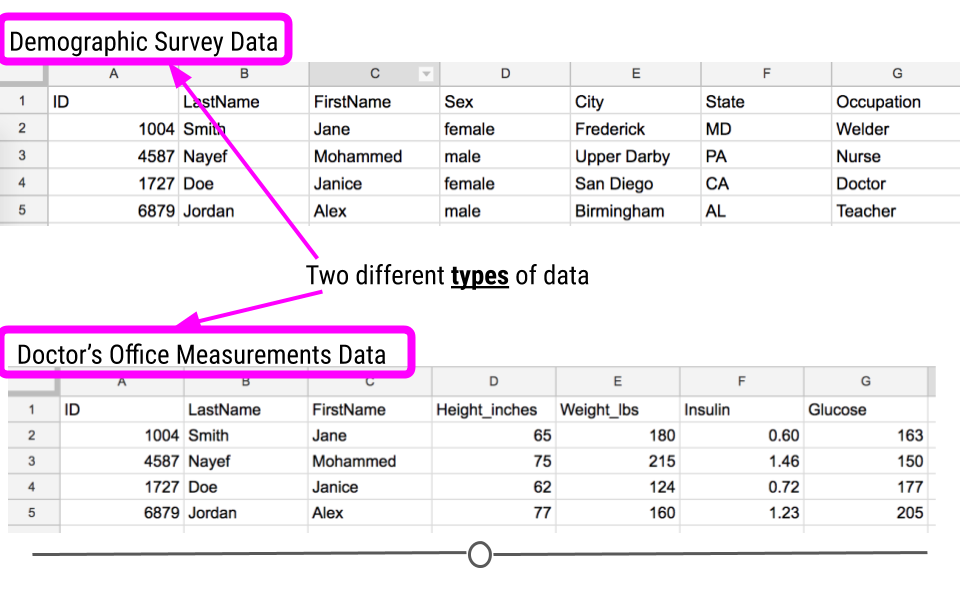
Often, data are collected for the same individuals from multiple sources. For example, when you go to the doctor’s office, you fill out a survey about yourself. That would count as one type of data. The measurements a doctor collects at your visit, however, would be a different type of data.
Subsection 1.2.2 Principles of Tidy Data
In Hadley Wickham’s 2014 paper titled "Tidy Data", he explains:
Tidy datasets are easy to manipulate, model and visualize, and have a specific structure: each variable is a column, each observation is a row, and each type of observational unit is a table.
These points are known as the tidy data principles. Here, we’ll break down each one to ensure that we are all on the same page going forward.
-
Each variable you measure should be in one column.
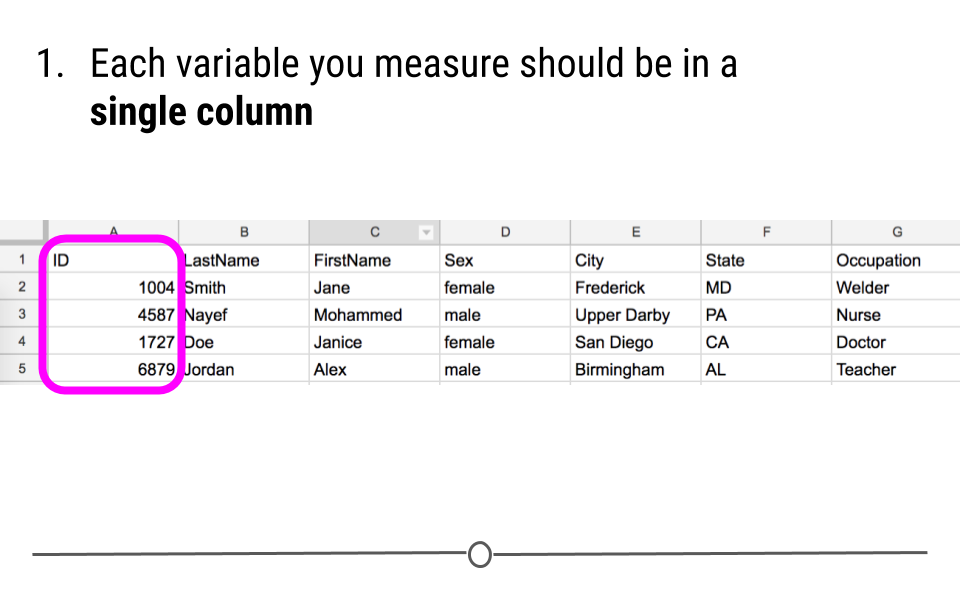
Figure 1.2.4. Principle #1 of Tidy Data -
Each different observation of that variable should be in a different row.
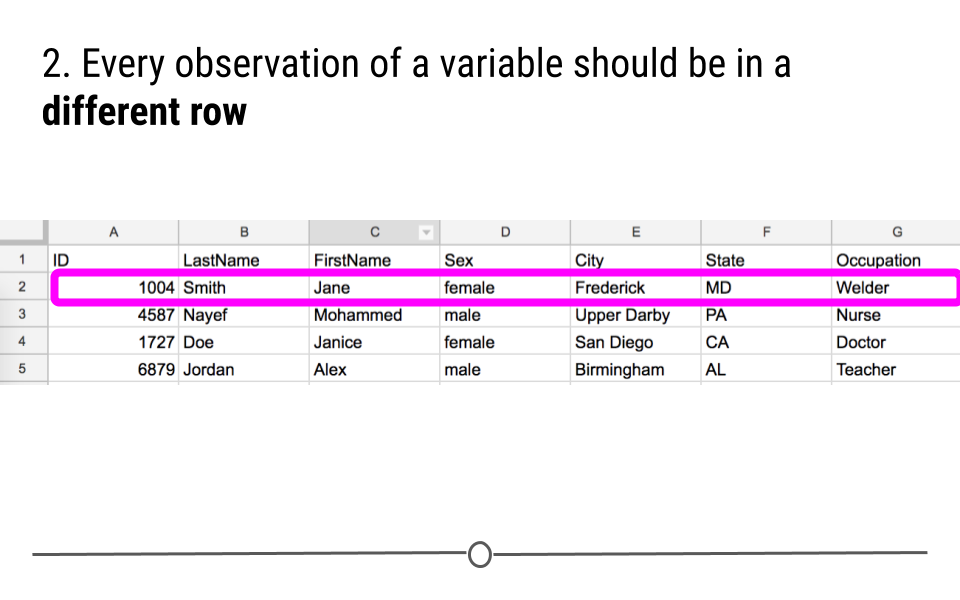
Figure 1.2.5. Principle #2 of Tidy Data -
There should be one table for each "type" of data.
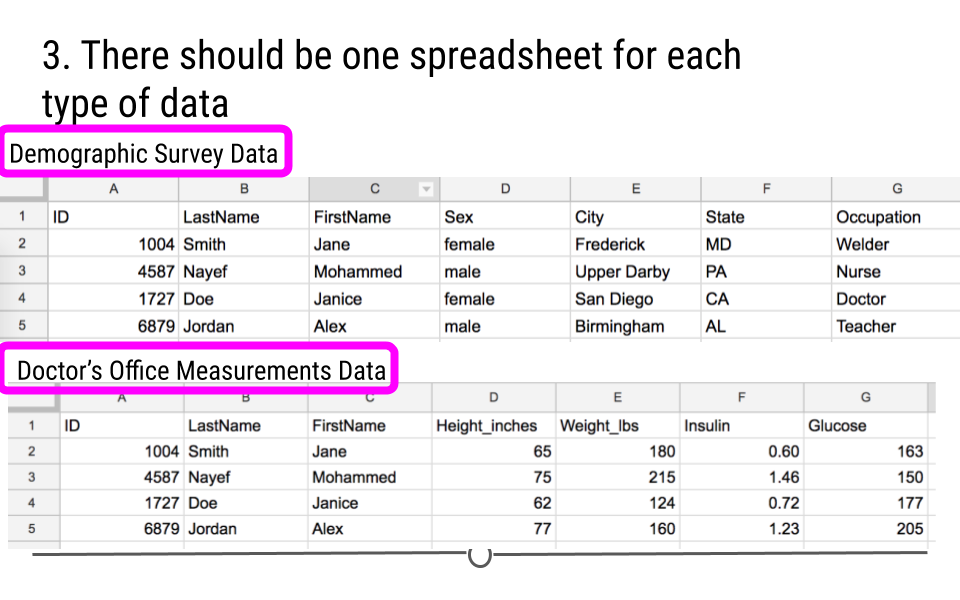
Figure 1.2.6. Principle #3 of Tidy Data -
If you have multiple tables, they should include a column in each spreadsheet (with the same column label!) that allows them to be joined or merged.
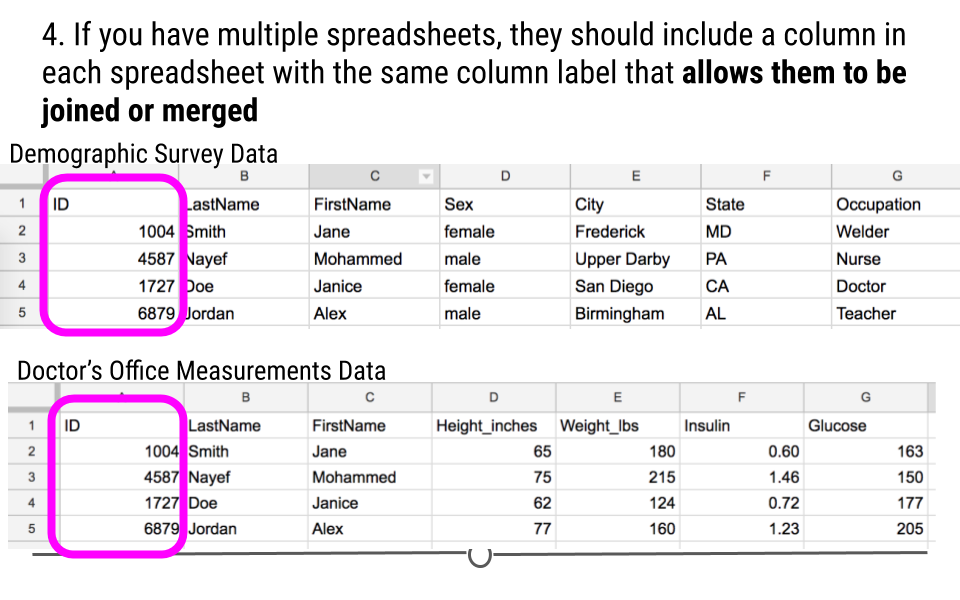
Figure 1.2.7. Principle #4 of Tidy Data
Subsection 1.2.3 Tidy Data Are Rectangular
When it comes to thinking about tidy data, remember that tidy data are rectangular data. The data should be a rectangle with each variable in a separate column and each entry in a different row. All cells should contain some text, so that the spreadsheet looks like a rectangle with something in every cell.
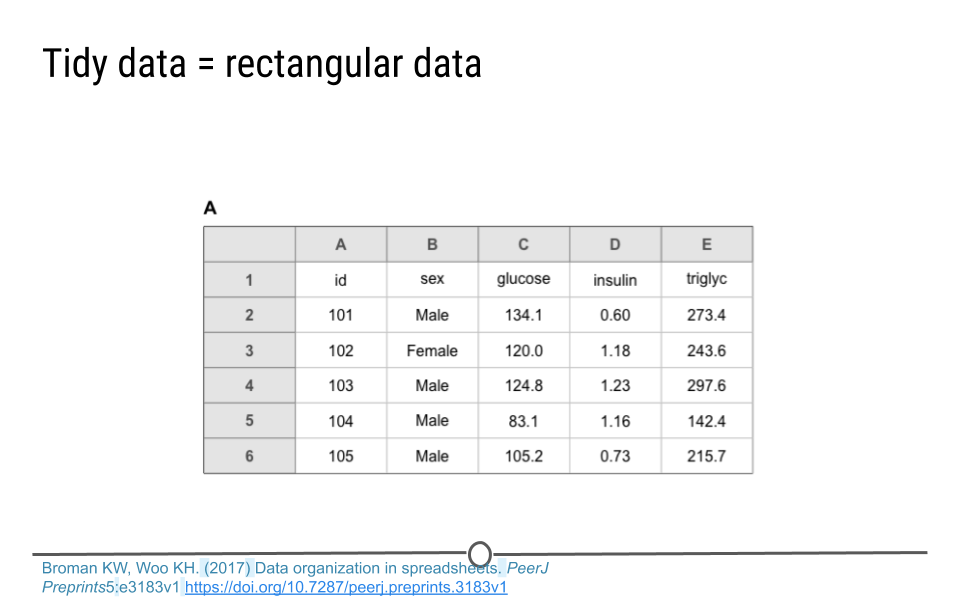
So, if you’re working with a dataset and attempting to tidy it, if you don’t have a rectangle at the end of the process, you likely have more work to do before it’s truly in a tidy data format.
Subsection 1.2.4 Tidy Data Benefits
There are a number of benefits to working within a tidy data framework:
-
Tidy data have a consistent data structure - This eliminates the many different ways in which data can be stored. By imposing a uniform data structure, the cognitive load imposed on the analyst is minimized for each new project.
-
Tidy data foster tool development - Software that all work within the tidy data framework can all work well with one another, even when developed by different individuals, ultimately increasing the variety and scope of tools available, without requiring analysts to learn an entirely new mental model with each new tool.
-
Tidy data require only a small set of tools to be learned - When using a consistent data format, only a small set of tools is required and these tools can be reused from one project to the next.
-
Tidy data allow for datasets to be combined - Data are often stored in multiple tables or in different locations. By getting each table into a tidy format, combining across tables or sources becomes trivial.
Subsection 1.2.5 Rules for Storing Tidy Data
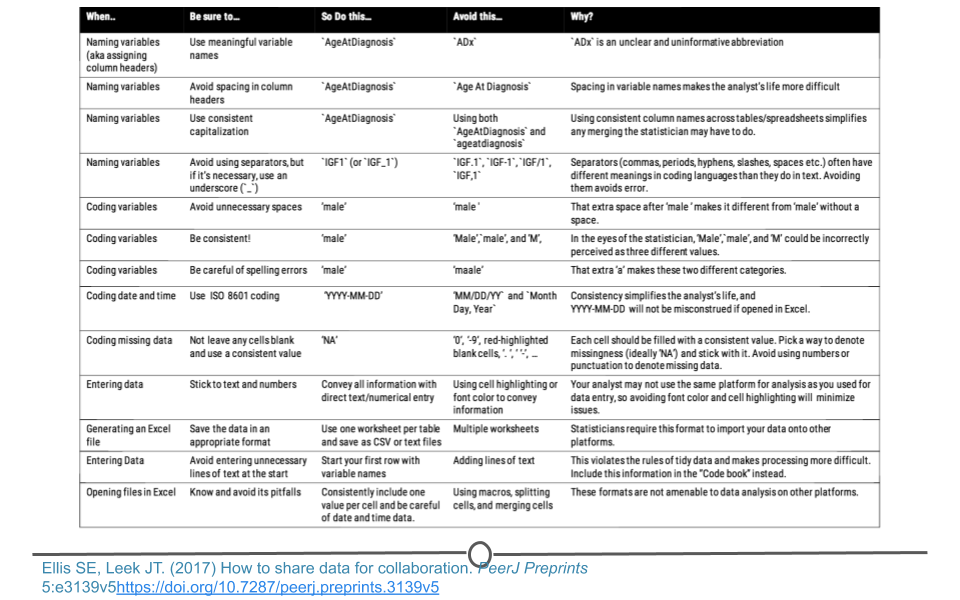
In addition to the four tidy data principles, there are a number of rules to follow when entering data to be stored, or when re-organizing untidy data that you have already been given for a project into a tidy format. They are rules that will help make data analysis and visualization easier down the road. They were formalized in a paper called "Data organization in spreadsheets", written by two prominent data scientists, Karl Broman and Kara Woo. In this paper, in addition to ensuring that the data are tidy, they suggest following these guidelines when entering data into spreadsheets:
-
Be consistent
-
Choose good names for things
-
Write dates as YYYY-MM-DD
-
No empty cells
-
Put just one thing in a cell
-
Don’t use font color or highlighting as data
-
Save the data as plain text files
We’ll go through each of these to make sure we’re all clear on what a great tidy spreadsheet looks like.
Subsubsection 1.2.5.1 Be consistent
Being consistent in data entry and throughout an analysis is key. It minimizes confusion and makes analysis simpler. For example, here we see sex is coded as "female" or "male." Those are the only two ways in which sex was entered into the data. This is an example of consistent data entry. You want to avoid sometimes coding a female’s sex as "female" and then entering it as "F" in other cases. Simply, you want to pick a way to code sex and stick to it.
With regard to entering a person’s sex, we were talking about how to code observations for a specific variable; however, consistency also matters when you’re choosing how to name a variable. If you use the variable name "ID" in one spreadsheet, use the same variable name ("ID") in the next spreadsheet. Do not change it to "id" (capitalization matters!) or "identifier" or anything else in the next spreadsheet. Be consistent!
Consistency matters across every step of the analysis. Name your files in a consistent format. Always code dates in a consistent format (discussed further below). Avoid extra spaces in cells. Being careful and consistent in data entry will be incredibly helpful when you get to the point of analyzing your data.
Subsubsection 1.2.5.2 Choose good names for things
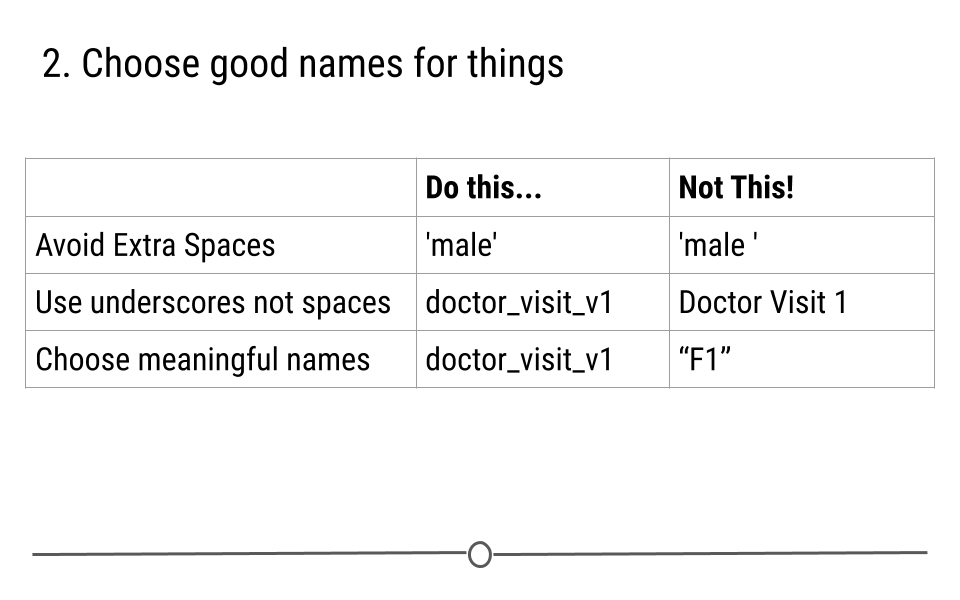
Choosing good variable names is important. Generally, avoid spaces in variable names and file names. You’ll see why this is important as we learn more about programming, but for now, know that "Doctor Visit 1" is not a good file name. "doctor_visit_v1" is much better. Stick to using underscores instead of spaces or any other symbol when possible. The same thing goes for variable names. "FirstName" is a good variable name while "First Name" with a space in the middle of it is not.
Additionally, make sure that file and variable names are as short as possible while still being meaningful. "F1" is short, but it doesn’t really tell you anything about what is in that file. "doctor_visit_v1" is a more meaningful file name. We know now that this spreadsheet contains information about a doctor’s visit. ’v1’ specifies version 1 allowing for updates to this file later which would create a new file "doctor_visit_v2."
Subsubsection 1.2.5.3 Write dates as YYYY-MM-DD
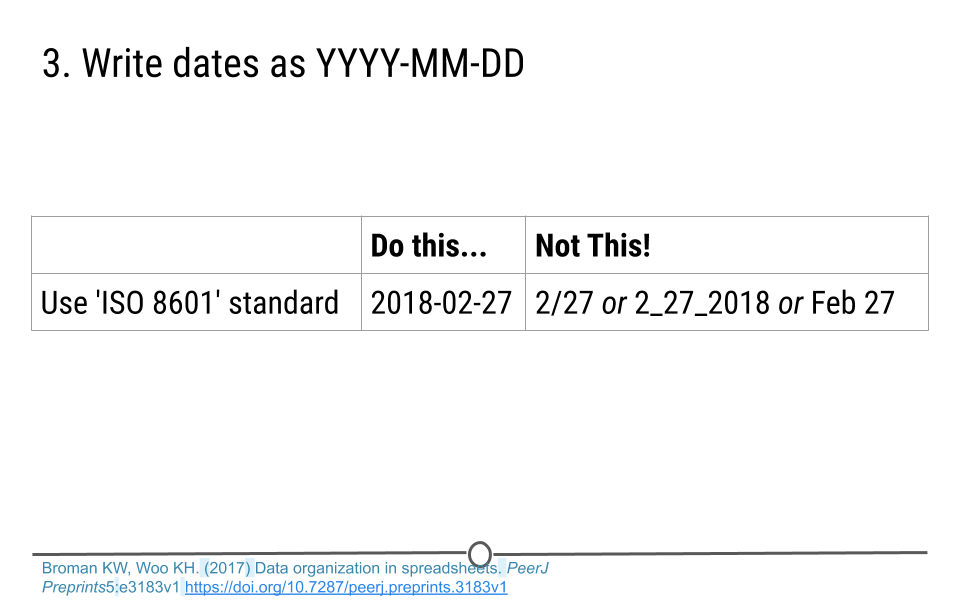
When entering dates, there is a global ISO 8601 standard. Dates should be encoded YYYY-MM-DD. For example if you want to specify that a measurement was taken on February 27th, 2018, you would type 2018-02-27. YYYY refers to the year, 2018. MM refers to the month of February, 02. And DD refers to the day of the month, 27. This standard is used for dates for two main reason. First, it avoids confusion when sharing data across different countries, where date conventions can differ. By all using ISO 8601 standard conventions, there is less room for error in interpretation of dates. Secondly, spreadsheet software often mishandles dates and assumes that non-date information are actually dates and vice versa. By encoding dates as YYYY-MM-DD, this confusion is minimized.
Subsubsection 1.2.5.4 No empty cells
Simply, fill in every cell. If the data is unknown for that cell, put
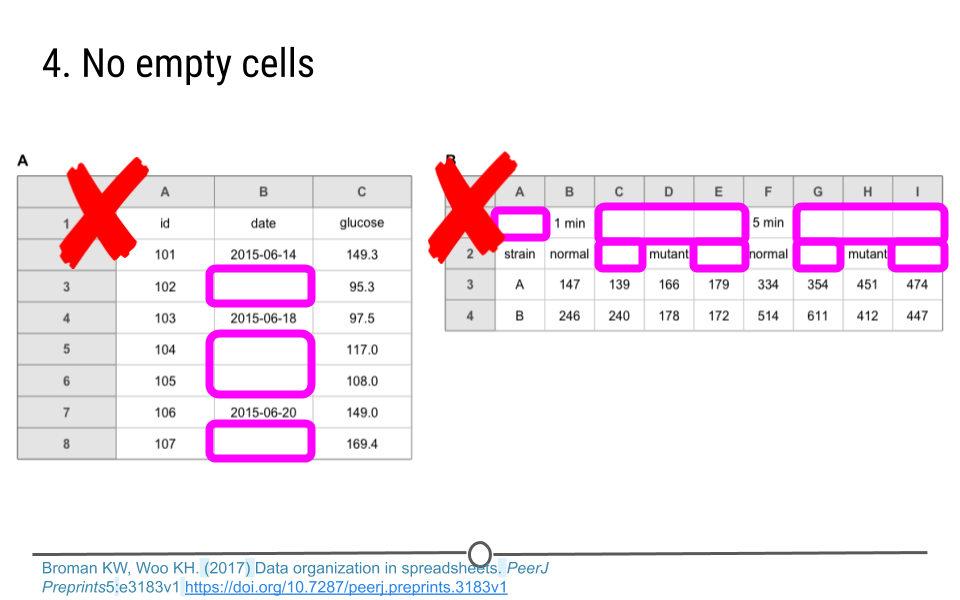
NA. Without information in each cell, the analyst is often left guessing. In the spreadsheets below, on the left, is the analyst to assume that the empty cells should use the date from the cell above? Or are we to assume that the date for that measurement is unknown? Fill in the date if it is known or type ’NA’ if it is not. That will clear up the need for any guessing on behalf of the analyst. On the spreadsheet to the right, the first two rows have a lot of empty cells. This is problematic for the analysis. This spreadsheet does not follow the rules for tidy data. There is not a single variable per column with a single entry per row. These data would have to be reformatted before they could be used in analysis.
Subsubsection 1.2.5.5 Put just one thing in a cell
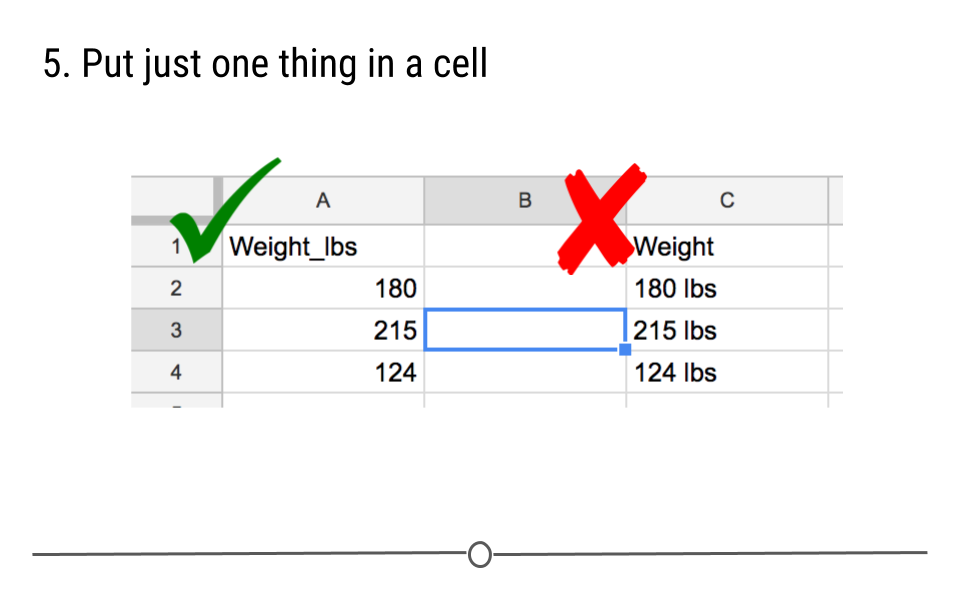
Sometimes people are tempted to include a number and a unit in a single cell. For weight, someone may want to put ’165 lbs’ in that cell. Avoid this temptation! Keep numbers and units separate. In this case, put one piece of information in the cell (the person’s weight) and either put the unit in a separate column, or better yet, make the variable name weight_lbs. That clears everything up for the analyst and avoids a number and a unit from both being put in a single cell. As analysts, we prefer weight information to be in number form if we want to make calculations or figures. This is facilitated by the first column called "Weight_lbs" because it will be read into R as a numeric object. The second column called "Weight", however, will be read into R as a character object because of the "lbs", which makes our desired tasks more difficult.
Subsubsection 1.2.5.6 Don’t use font color or highlighting as data
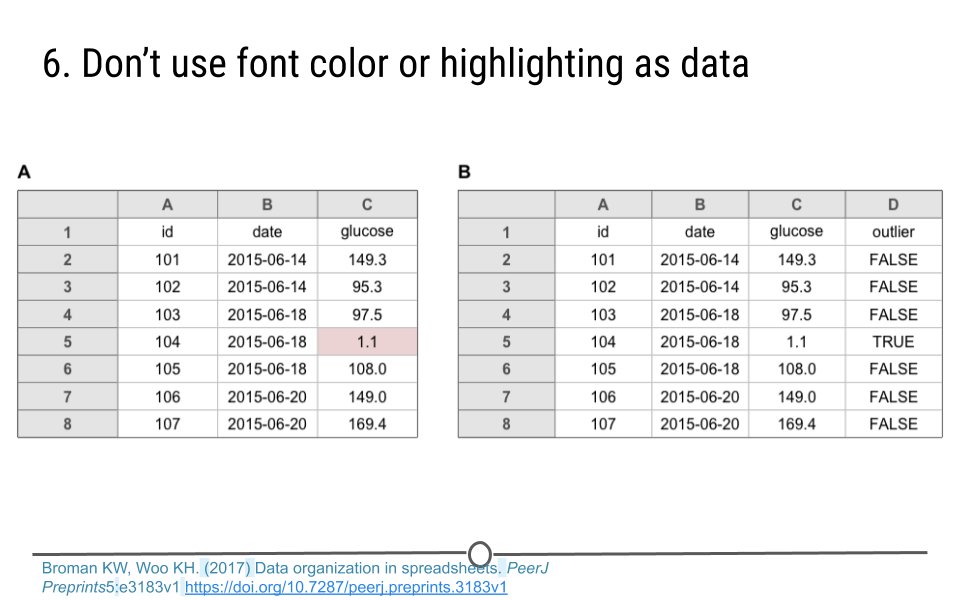
Avoid the temptation to highlight particular cells with a color to specify something about the data. Instead, add another column to convey that information. In the example below, 1.1 looks like an incorrect value for an individual’s glucose measure. Instead of highlighting the value in red, create a new variable. Here, on the right, this column has been named ’outlier.’ Including ’TRUE’ for this individual suggests that this individual may be an outlier to the data analyst. Doing it in this way ensures that this information will not be lost. Using font color or highlighting however can easily be lost in data processing, as you will see in future lessons.
Subsubsection 1.2.5.7 Save the data as plain text files
The following lessons will go into detail about which file formats are ideal for saving data, such as text files (.txt) and comma-delimited files (.csv). These file formats can easily be opened and will never require special software, ensuring that they will be usable no matter what computer or analyst is looking at the data.
Subsubsection 1.2.5.8 Summary
The data entry guidelines discussed in and a few additional rules have been summarized below and are available online for reference.