Section 5.6 Inference
Inferential Analysis is what analysts carry out after they’ve described and explored their dataset. After understanding your dataset better, analysts often try to infer something from the data. This is done using statistical tests.
We discussed a bit about how we can use models to perform inference and prediction analyses. What does this mean?
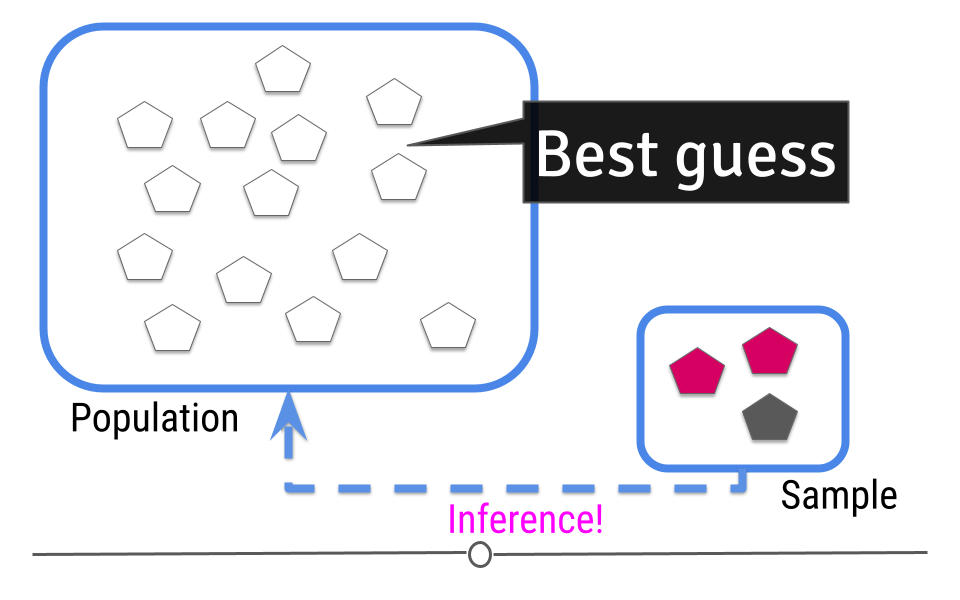
The goal of inferential analyses is to use a relatively small sample of data to infer or say something about the population at large. This is required because often we want to answer questions about a population. Let’s take a dummy example here where we have a population of 14 shapes. Here, in this graphic, the shapes represent individuals in the population and the colors of the shapes can be either pink or grey:
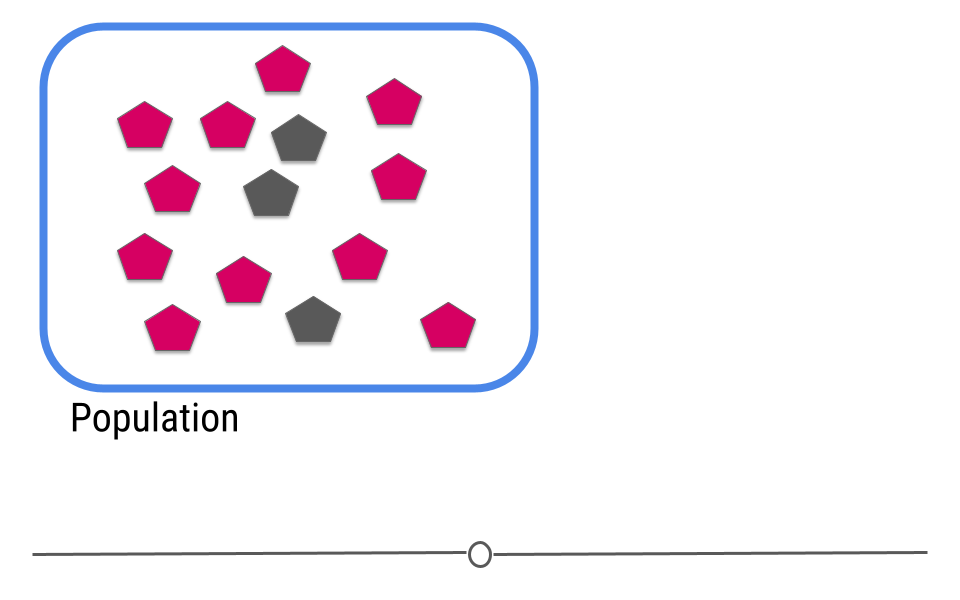
In this example we only have fourteen shapes in the population; however, in inferential data analysis, it’s not usually possible to sample everyone in the population. Consider if this population were everyone in the United States or every college student in the world. As getting information from every individual would be infeasible. Data are instead collected on a subset, or a sample of the individuals in the larger population.
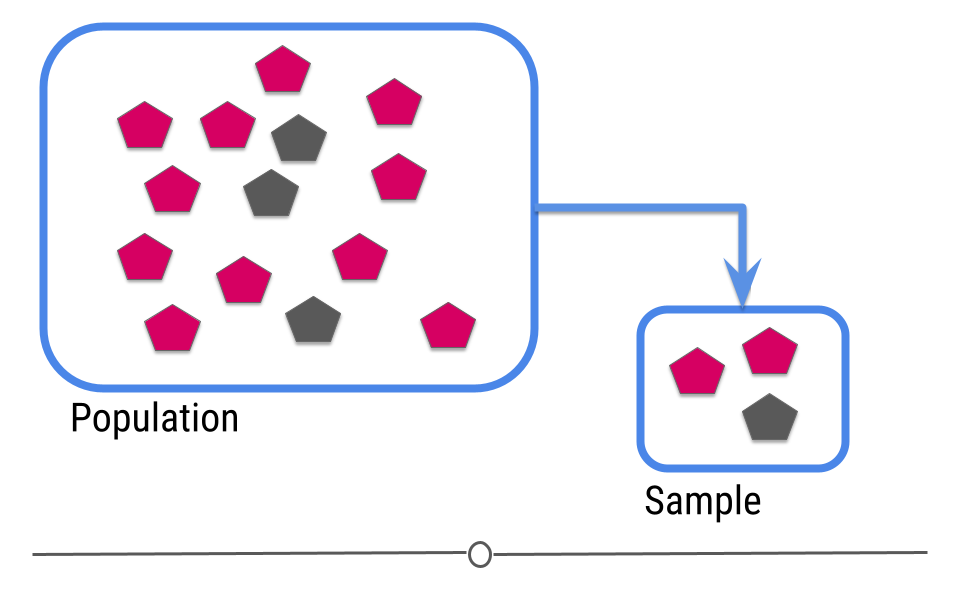
In our example, we’ve been showing you how many pink and how many gray shapes are in the larger population. However, in real life, we don’t know what the answer is in the larger population. That’s why we collected the sample!
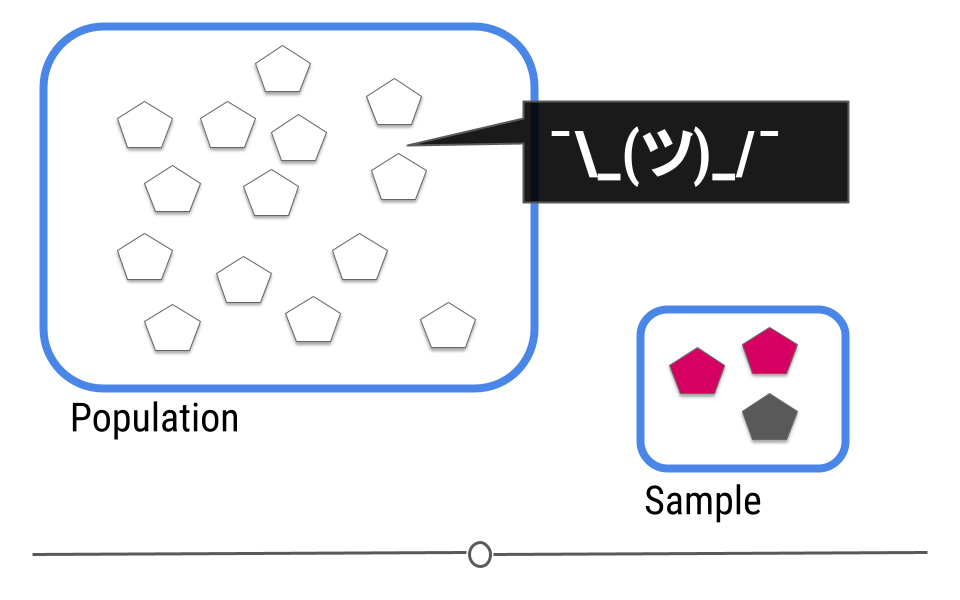
This is where inference comes into play. We analyze the data collected in our sample and then do our best to infer what the answer is in the larger population. In other words, inferential data analysis uses data from a sample to make its best guess as to what the answer would be in the population if we were able to measure every individual.
Subsection 5.6.1 Uncertainty
Because we haven’t directly measured the population but have only been able to take measurements on a sample of the data, when making our inference we can’t be exactly sure that our inference about the population is exact. For example, in our sample one-third of the shapes are grey. We’d expect about one-third of the shapes in our population to be grey then too! Well, one-third of 14 (the number of shapes in our population) is 4.667. Does this mean four shapes are truly gray?
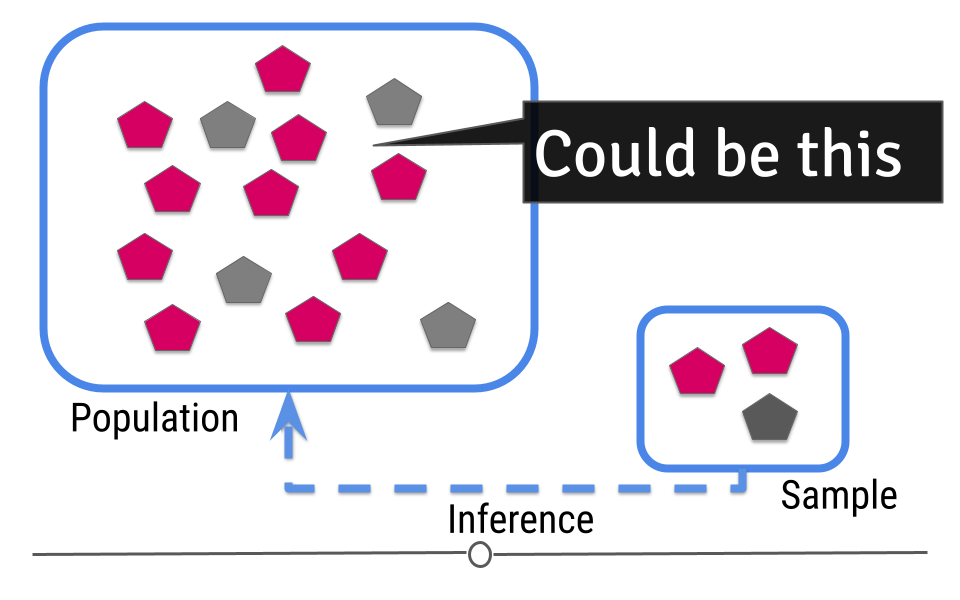
Or maybe five shapes in the population are grey?
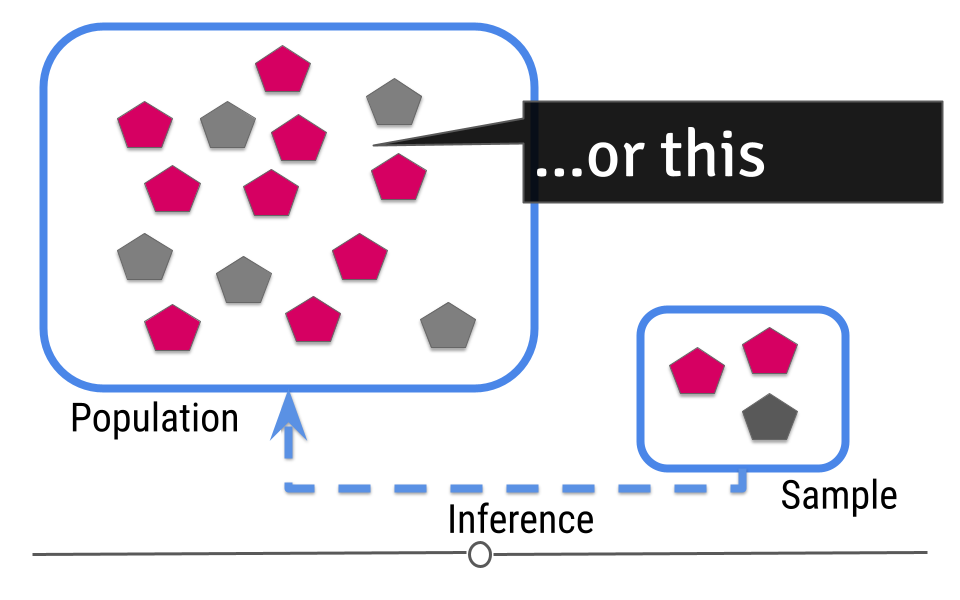
Given the sample we’ve taken, we can guess that 4-5 shapes in our population will be grey, but we aren’t certain exactly what that number is. In statistics, this "best guess" is known as an estimate. This means that we estimate that 4.667 shapes will be gray. But, there is uncertainty in that number. Because we’re taking our best guess at figuring out what that estimate should be, there’s also a measure of uncertainty in that estimate. Inferential data analysis includes generating the estimate and the measure of uncertainty around that estimate.
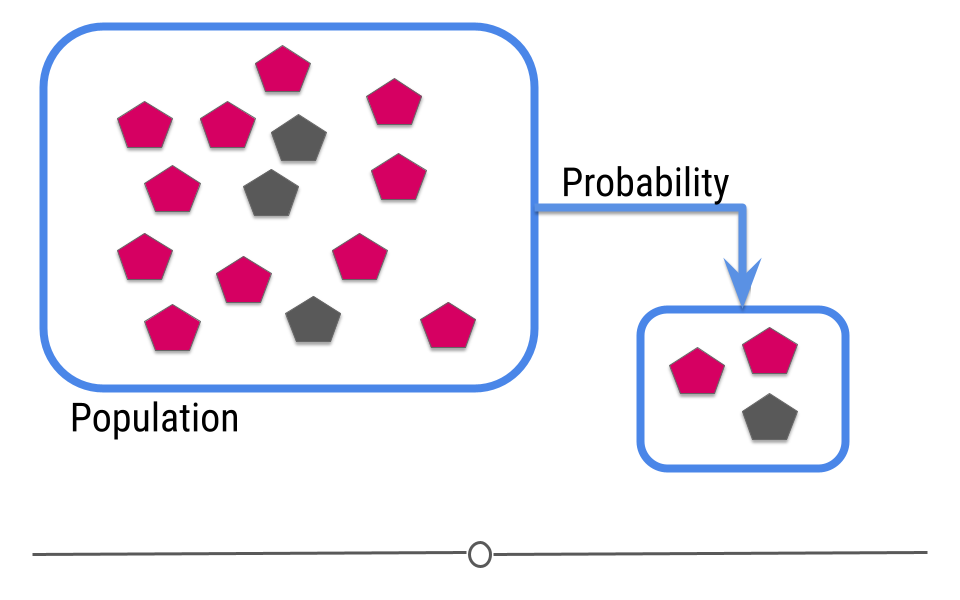
Let’s return back to the example where we know the truth in the population. Hey look! There were actually only three grey shapes after all. It is totally possible that if you put all those shapes into a bag and pulled three out that two would be pink and one would be grey. As statisticians, we’d say that getting this sample was probable (it’s within the realm of possibility). This really drives home why it’s important to add uncertainty to your estimate whenever you’re doing inferential analysis!
Subsection 5.6.2 Random Sampling
Since you are moving from a small amount of data and trying to generalize to a larger population, your ability to accurately infer information about the larger population depends heavily on how the data were sampled.
The data in your sample must be representative of your larger population to be used for inferential data analysis. Let’s discuss what this means.
Using the same example, what if, in your larger population, you didn’t just have grey and pink shapes, but you also had blue shapes?
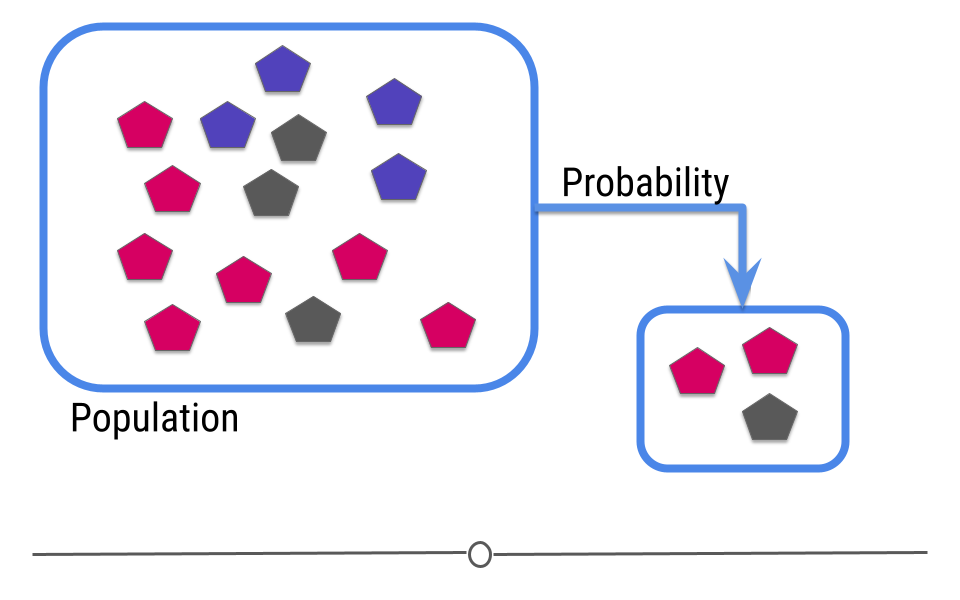
Well, if your sample only has pink and grey shapes, when you go to make an inference, there’s no way you’d infer that there should be blue shapes in your population since you didn’t capture any in your sample.
In this case, your sample is not representative of your larger population. In cases where you do not have a representative sample, you can not carry out inference, since you will not be able to correctly infer information about the larger population.
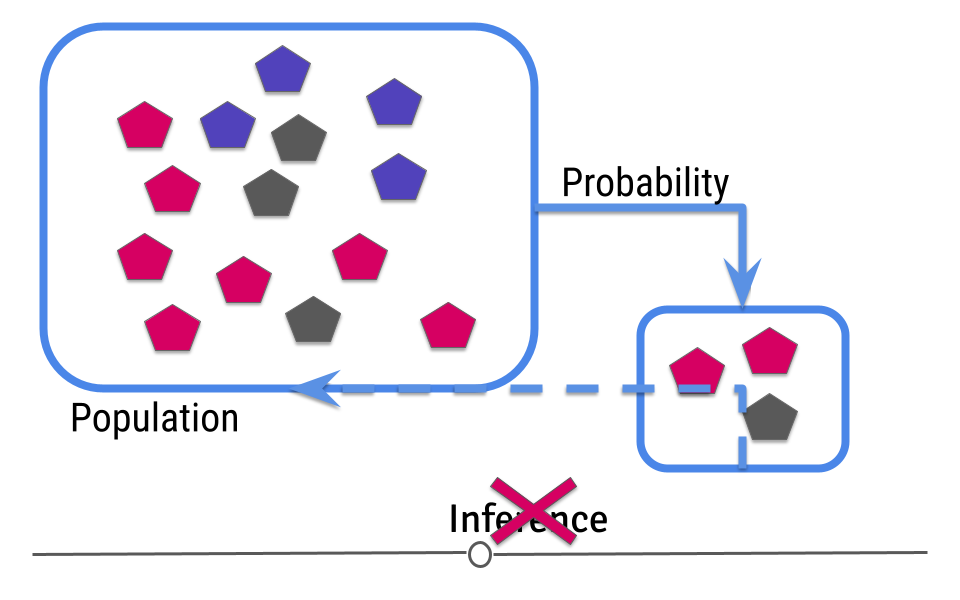
This means that you have to design your analysis so that you’re collecting representative data and that you have to check your data after data collection to make sure that you were successful.
You may at this point be thinking to yourself. "Wait a second. I thought I didn’t know what the truth was in the population. How can I make sure it’s representative?" Good point! With regards to the measurement you’re making (color distribution of the shapes, in this example), you don’t know the truth. But, you should know other information about the population. What is the age distribution of your population? Your sample should have a similar age distribution. What proportion of your population is female? If it’s half, then your sample should be comprised of half females. Your data collection procedure should be set up to ensure that the sample you collect is representative (very similar to) your larger population. Then, once the data are collected, your descriptive analysis should check to ensure that the data you’ve collected are in fact representative of your larger population. Randomly sampling your larger population helps ensure that the inference you make about the measurement of interest (color distribution of the shapes) will be the most accurate.
To reiterate: If the data you collect is not from a representative sample of the population, the generalizations you infer won’t be accurate for the population.
Subsubsection 5.6.2.1 An example of inferential data analysis
Unlike in our previous examples, Census data wouldn’t be used for inferential analysis. By definition, a census already collects information on (functionally) the entire population. Thus, there is no population on which to infer. Census data are the rare exception where a whole population is included in the dataset. Further, using data from the US census to infer information about another country would not be a good idea because the US isn’t necessarily representative of the other country.
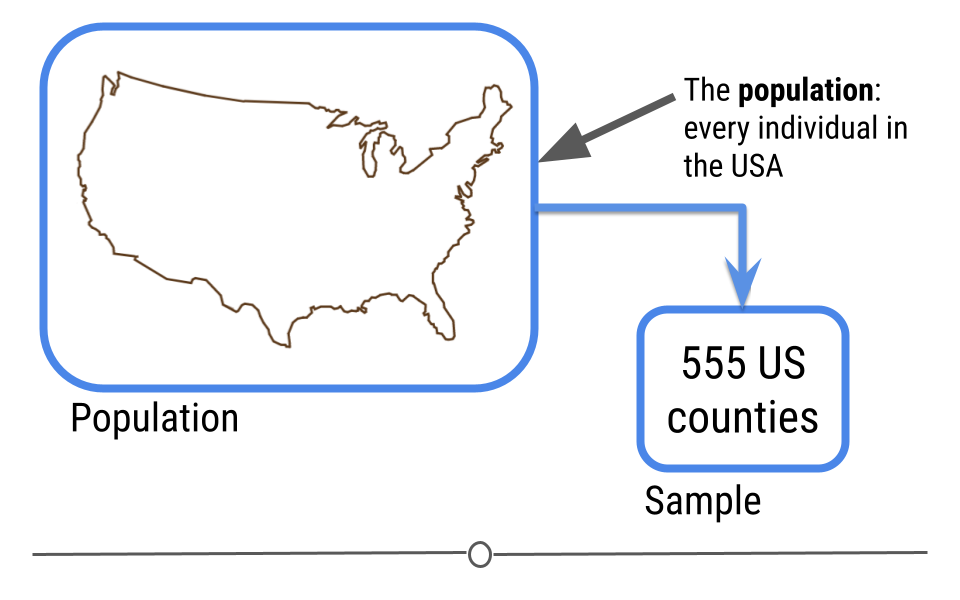
Instead, a better example of a dataset on which to carry out inferential analysis would be the data used in the study: The Effect of Air Pollution Control on Life Expectancy in the the United States: An Analysis of 545 US counties for the period 2000 to 2007. In this study, researchers set out to understand the effect of air pollution on everyone in the United States
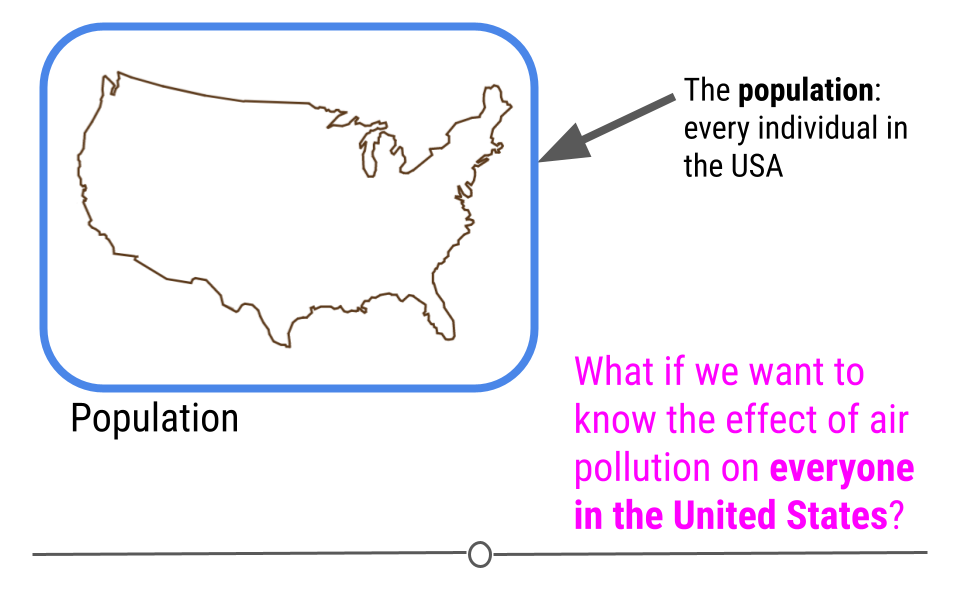
To answer this question, a subset of the US population was studied, and the researchers looked at the level of air pollution experienced and life expectancy. It would have been nearly impossible to study every individual in the United States year after year. Instead, this study used the data they collected from a sample of the US population to infer how air pollution might be impacting life expectancy in the entire US!