Section 11.1 Review
Let’s go over a refresher of what you’ve covered so far. You first got started with data in Chapter 1 where you learned about the difference between R and RStudio, started coding in R, installed and loaded your first R packages, and explored your first dataset: all domestic departure
flights from a major New York City airport in 2023. Then you covered the following three parts of this book (Parts 2 and 4 are combined into a single portion):
-
Data science with
tidyverse. You assembled your data science toolbox usingtidyversepackages. In particular, you-
Chapter 2: Visualized data using the
ggplot2package. -
Chapter 3: Wrangled data using the
dplyrpackage. -
Chapter 4: Learned about the concept of “tidy” data as a standardized data frame input and output format for all packages in the
tidyverse. Furthermore, you learned how to import spreadsheet files into R using thereadrpackage.
-
-
Statistical/Data modeling with
moderndive. Using these data science tools and helper functions from themoderndivepackage, you fit your first data models. In particular, you -
Statistical inference with
infer. Once again using your newly acquired data science tools, you unpacked statistical inference using theinferpackage. In particular, you-
Chapter 7: Learned about the role that sampling variability plays in statistical inference and the role that sample size plays in this sampling variability.
-
Chapter 8: Constructed confidence intervals using bootstrapping and learned some about a theory-based approach to confidence intervals.
-
Chapter 9: Conducted hypothesis tests using permutation.
-
-
Statistical/Data modeling with
moderndive(revisited): Armed with your understanding of statistical inference, you revisited and reviewed the models you constructed in Chapter 5 and Ch. Chapter 6. In particular, you-
Chapter 10: Interpreted confidence intervals and hypothesis tests in a regression setting using both theory-based and simulation-based approaches.
-
We’ve guided you through your first experiences of “thinking with data,” an expression originally coined by Dr. Diane Lambert . The philosophy underlying this expression guided your path in the flowchart in Figure 11.0.1.
This philosophy is also well-summarized in “Practical Data Science for Stats”: a collection of pre-prints focusing on the practical side of data science workflows and statistical analysis curated by Dr. Jennifer Bryan and Dr. Hadley Wickham. They quote:
There are many aspects of day-to-day analytical work that are almost absent from the conventional statistics literature and curriculum. And yet these activities account for a considerable share of the time and effort of data analysts and applied statisticians. The goal of this collection is to increase the visibility and adoption of modern data analytical workflows. We aim to facilitate the transfer of tools and frameworks between industry and academia, between software engineering and statistics and computer science, and across different domains.
In other words, to be equipped to “think with data” in the 21st century and beyond, analysts need practice going through the “data/science pipeline” we saw in the Preface (re-displayed in Figure 11.1.1). It is our opinion that, for too long, statistics education has only focused on parts of this pipeline, instead of going through it in its entirety.
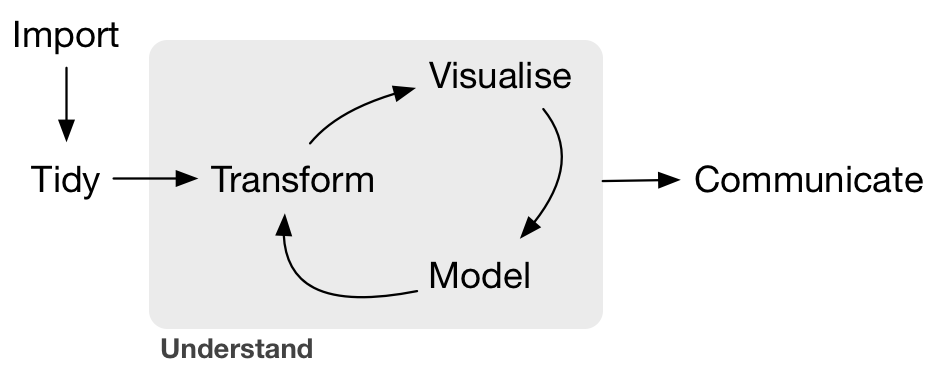
To conclude this book, we’ll present you with some additional case studies of working with data. In Section 11.2 we’ll take you through a full-pass of the “Data/Science Pipeline” in order to analyze the sale price of houses in Seattle, Washington, USA. In Section 11.3, we’ll present you with some examples of effective data storytelling drawn from the data journalism website, FiveThirtyEight.com. We present these case studies to you because we believe that you should not only be able to “think with data,” but also be able to “tell your story with data.” Let’s explore how to do this!
Subsection 11.1.1 Needed packages
Let’s load all the packages needed for this chapter (this assumes you’ve already installed them). Read Section 1.3 for information on how to install and load R packages.
library(tidyverse)
library(moderndive)
library(fivethirtyeight)
library(infer)

