Section 1.5 Conclusion
This chapter provides a small set of tools to explore data in R, but it’s far from exhaustive. Including everything would overwhelm rather than help. The best way to add to your toolbox is running and writing code in RStudio as much as possible.
Subsection 1.5.1 Additional resources
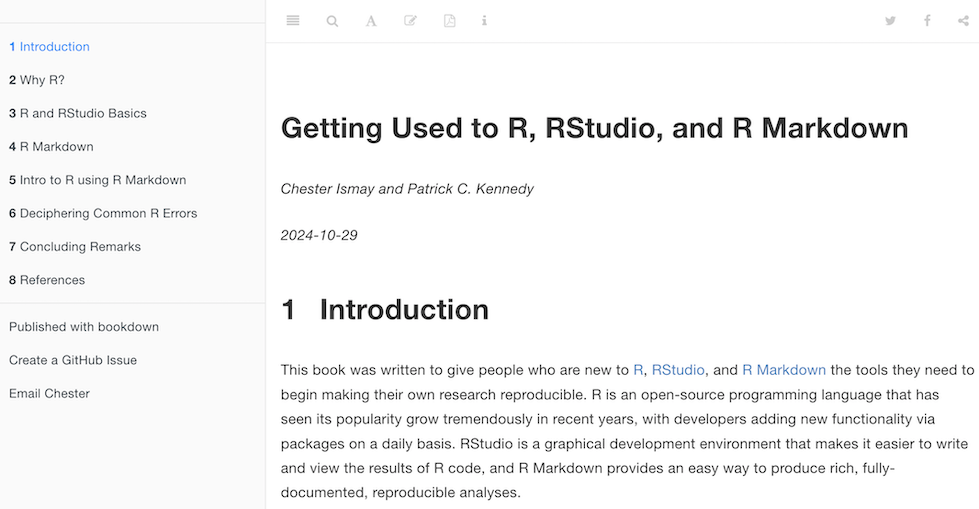
If you are new to the world of coding, R, and RStudio and feel you could benefit from a more detailed introduction, we suggest the short book, Getting Used to R, RStudio, and R Markdown [5], previewed in Figure 1.5.1. It includes screencasts that you can follow along and pause as you learn. This book also contains an introduction to R Markdown, a tool used for reproducible research.
Subsection 1.5.2 What’s to come?
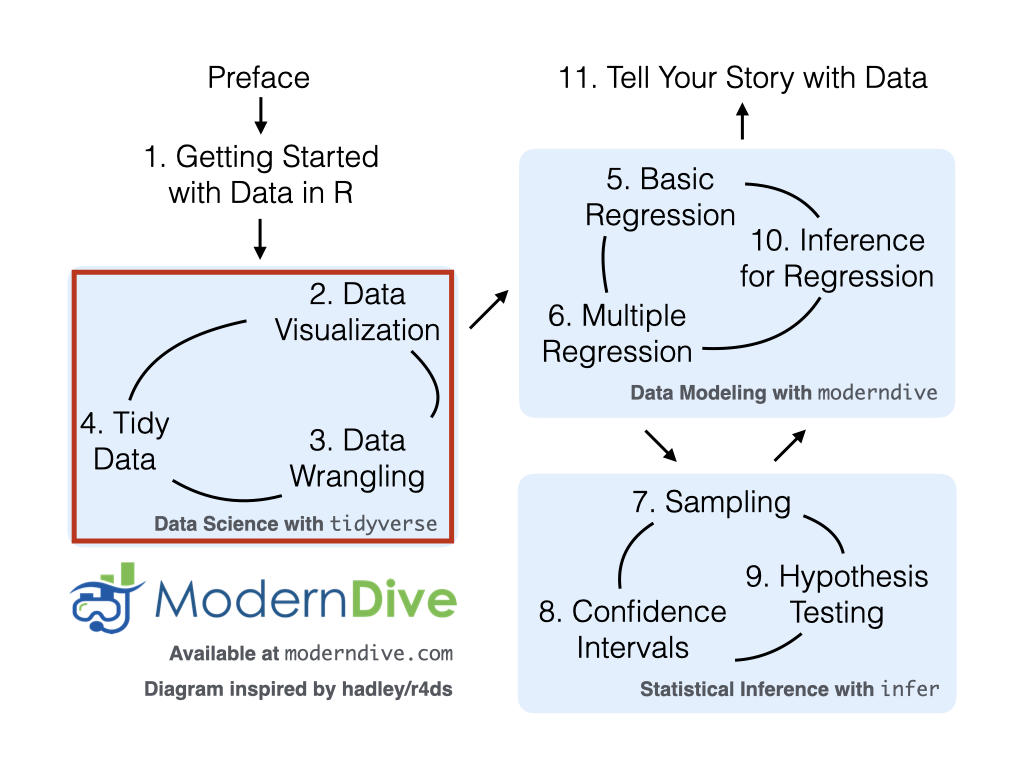
We’re next heading into the “Data Science with
tidyverse” portion in Chapter 2 as shown in Figure 1.5.2 with what we feel is the most important tool in a data scientist’s toolbox: data visualization. We’ll continue to explore the data included in the moderndive and nycflights23 packages using the ggplot2 package for data visualization. Data visualization is a powerful tool to add to your toolbox for data exploration that provides additional insight to what the View() and glimpse() functions can provide.