Section 4.5 Conclusion
Subsection 4.5.1 Additional resources
An R script file of all R code used in this chapter is available here.
If you want to learn more about using the
readr and tidyr package, we suggest that you check out RStudio’s “Data Import Cheat Sheet.” In the current version of RStudio in mid-2025, you can access this cheatsheet by going to the RStudio Menu Bar \(\to\) Help \(\to\) Cheat Sheets \(\to\) “Browse Cheat Sheets...” \(\to\) Scroll down the page to the “Data import with reader, readxl, and googlesheets4...” for information on using the readr, readxl and googlesheets4 packages to import data and the “Data tidying with tidyr cheatsheet” for information on using the tidyr package to “tidy” data. You can see a preview of both cheatsheets in the figures below.
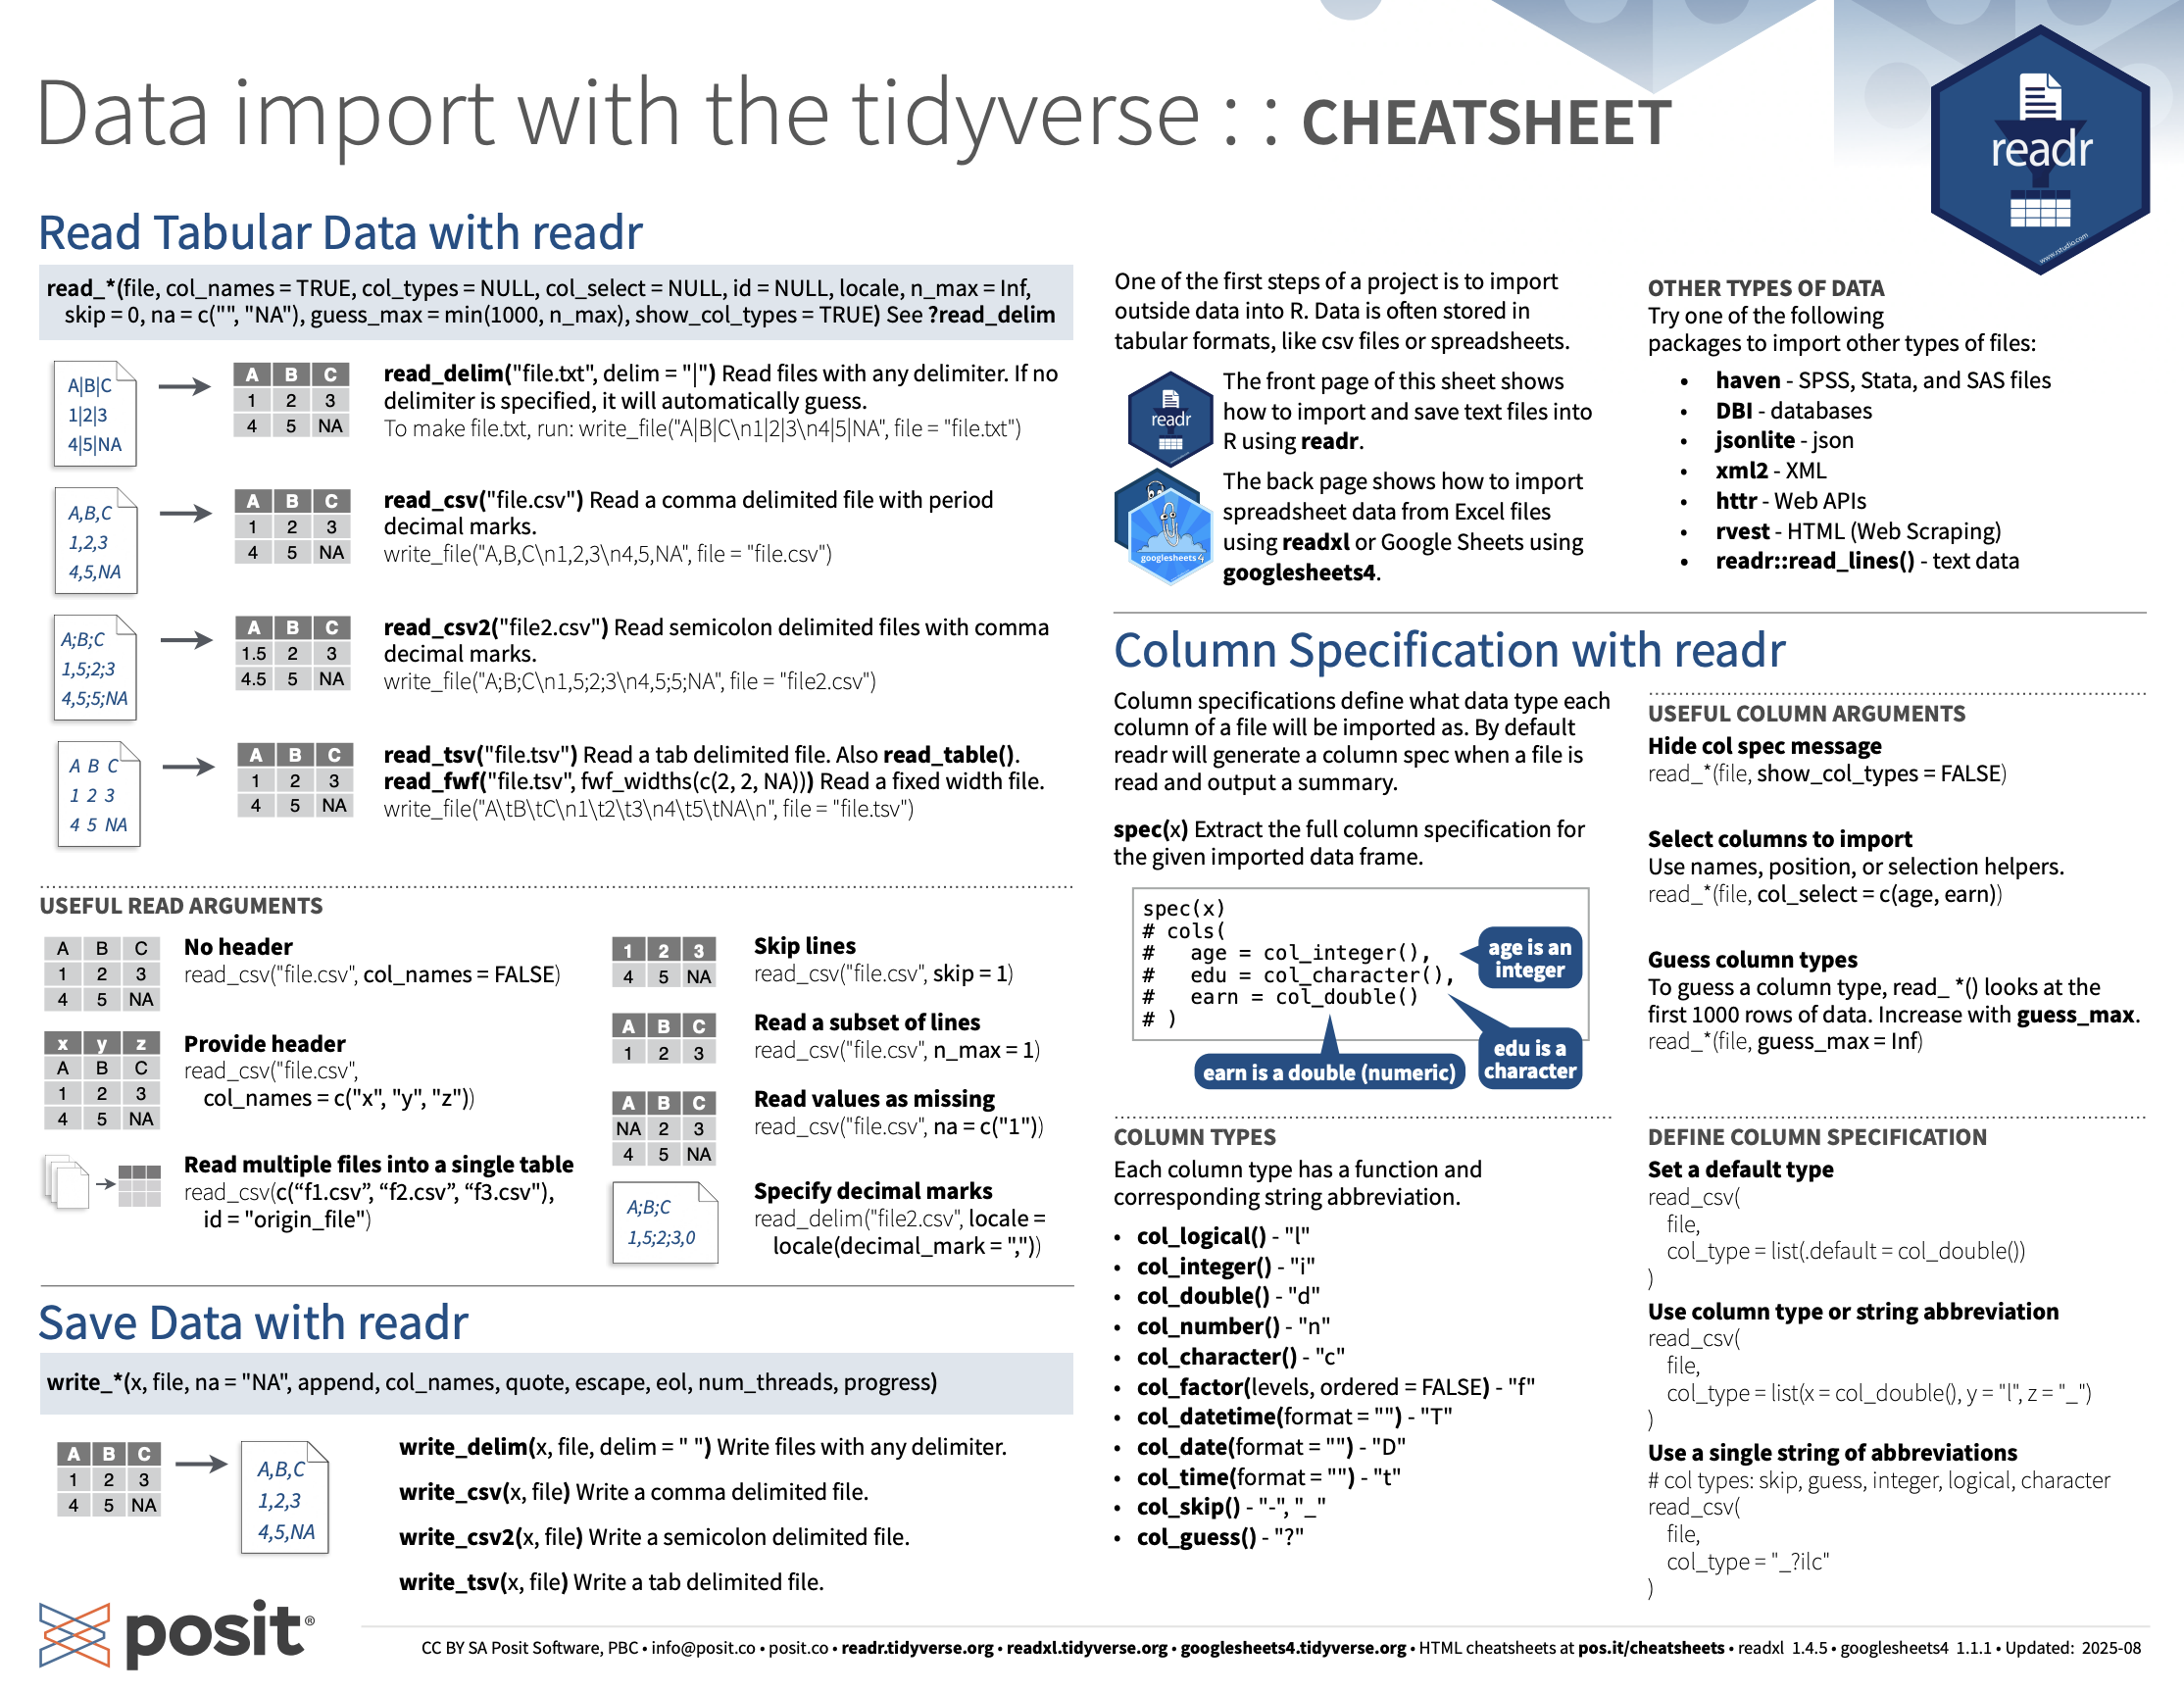
readr package.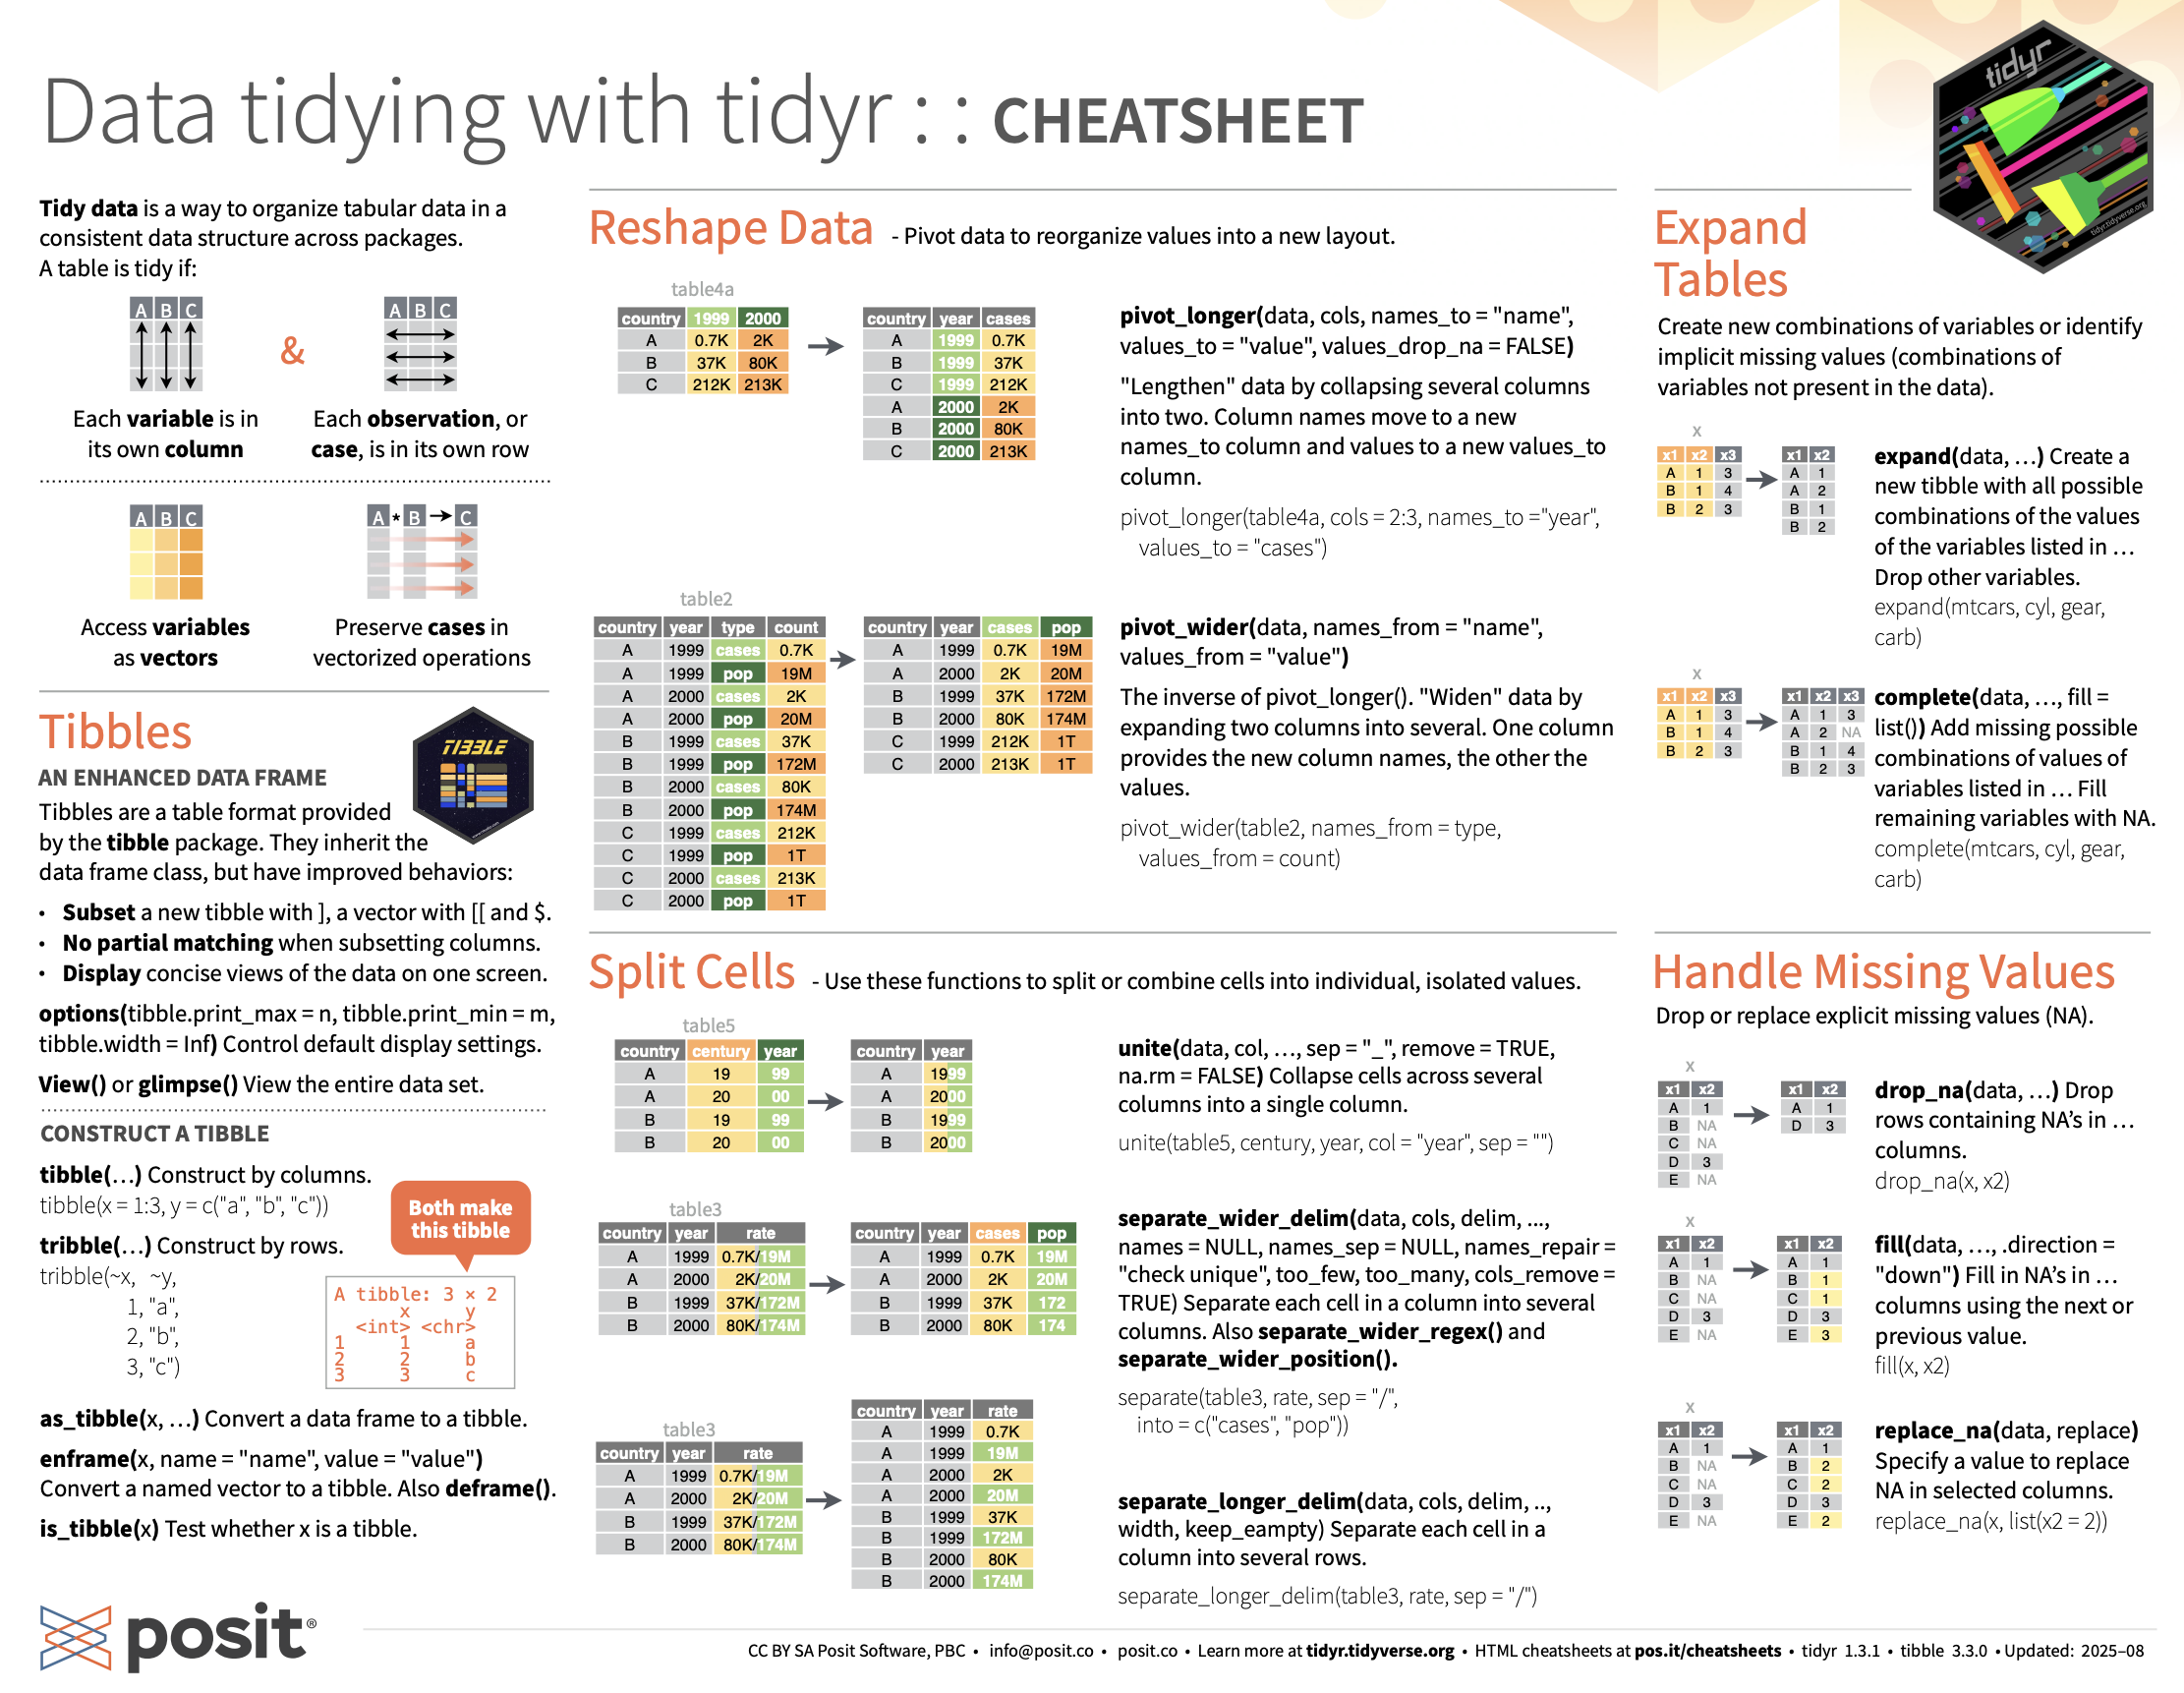
tidyr package.Subsection 4.5.2 What’s to come?
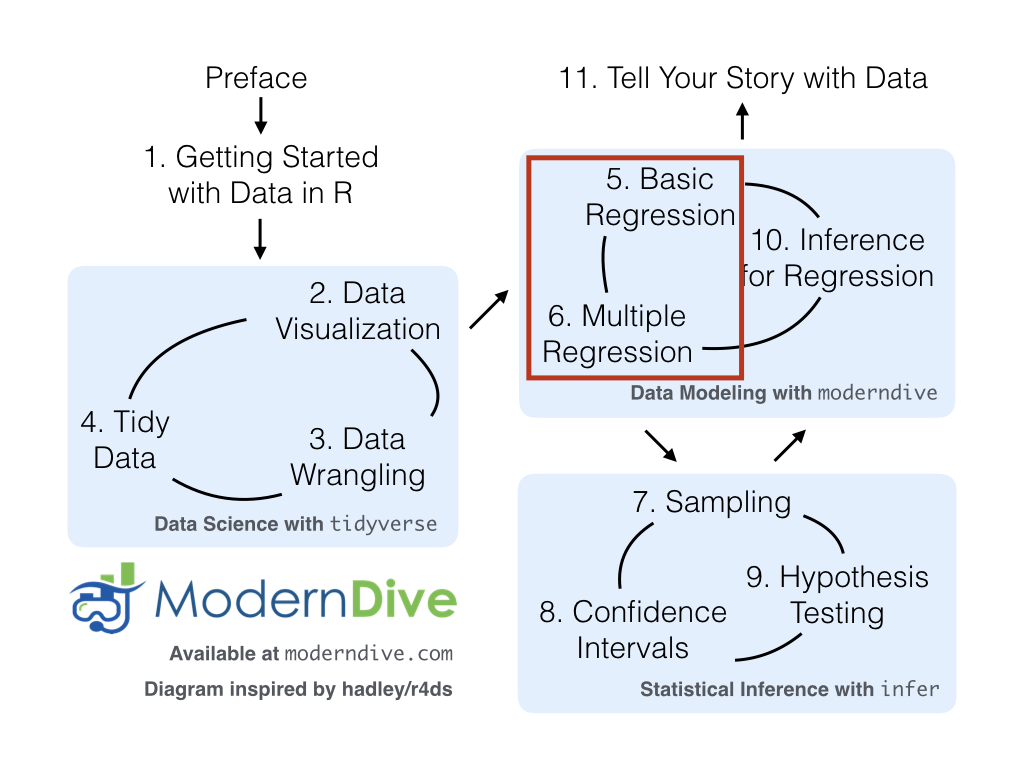
Congratulations! You’ve completed the “Data Science with
tidyverse” portion of this book. We’ll now move to the “Statistical modeling with moderndive” portion of this book in Chapter 5 and Chapter 6, where you’ll leverage your data visualization and wrangling skills to model relationships between different variables in data frames.
However, we’re going to leave Chapter 10 on “Inference for Regression” until after we’ve covered statistical inference in Chapter 7, Chapter 8, and Chapter 9. Onwards and upwards into Statistical/Data Modeling as shown in Figure 4.5.3!