Section E.2 Implied Probability
More generally, we can compute the expected value of each wager for a range of probabilities from 0 to 1.
ps = np.linspace(0, 1)
ev_patriots = expected_value(ps, 100, 195)
ps = np.linspace(0, 1)
ev_seahawks = expected_value(1-ps, 240, 100)
Here’s what they look like.
plt.plot(ps, ev_patriots, label='Bet on Patriots')
plt.plot(ps, ev_seahawks, label='Bet on Seahawks')
plt.axhline(0, color='gray', alpha=0.4)

decorate(xlabel='Actual probability Patriots win',
        ylabel='Expected value of wager')
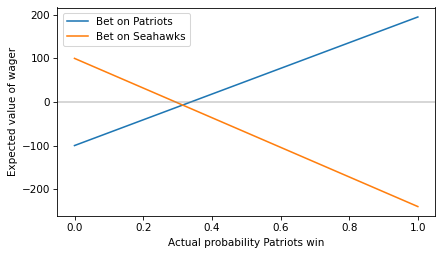
To find the crossover point, we can set the expected value to 0 and solve for
p. This function computes the result:
def crossover(wager, payout):
    return wager / (wager + payout)
Here’s the crossover for a bet on the Patriots at the offered odds.
$ p1 = crossover(100, 195)
p1
0.3389830508474576
If you think the Patriots have a probability higher than the crossover, the first bet has positive expected value. And here’s the crossover for a bet on the Seahawks.
$ p2 = crossover(240, 100)
p2
0.7058823529411765
If you think the Seahawks have a probability higher than this crossover, the second bet has positive expected value.
So the offered odds imply that the consensus view of the betting market is that the Patriots have a 33.9% chance of winning and the Seahawks have a 70.6% chance. But you might notice that the sum of those probabilities exceeds 1.
$ p1 + p2
1.0448654037886342

