Section 2.4 First Babies
Now let’s compare the distribution of pregnancy lengths for first babies and others. We can use the
query method to select rows that represent first babies and others.
firsts = live.query("birthord == 1")
others = live.query("birthord != 1")
And make a
FreqTab of pregnancy lengths for each group.
ftab_first = FreqTab.from_seq(firsts["prglngth"], name="firsts")
ftab_other = FreqTab.from_seq(others["prglngth"], name="others")
The following function plots two frequency tables side-by-side.
def two_bar_plots(ftab1, ftab2, width=0.45):
    ftab1.bar(align="edge", width=-width)
    ftab2.bar(align="edge", width=width, alpha=0.5)
Here’s what they look like.
two_bar_plots(ftab_first, ftab_other)
decorate(xlabel="Weeks", ylabel="Frequency", xlim=[20, 50])
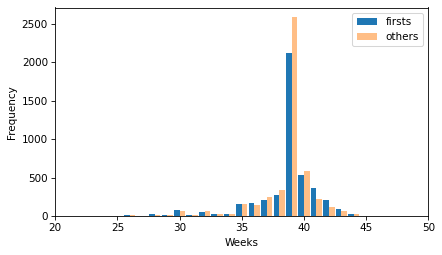
There is no obvious difference in the shape of the distributions or in the outliers. It looks like more of the non-first babies are born during week 39, but there are more non-first babies in the dataset, so we should not compare the counts directly.
$ firsts["prglngth"].count(), others["prglngth"].count()
(np.int64(4413), np.int64(4735))
Comparing the means of the distributions, it looks like first babies are a little bit later on average.
$ first_mean = firsts["prglngth"].mean()
other_mean = others["prglngth"].mean()
first_mean, other_mean
(np.float64(38.60095173351461), np.float64(38.52291446673706))
But the difference is only 0.078 weeks, which is about 13 hours.
$ diff = first_mean - other_mean
diff, diff * 7 * 24
(np.float64(0.07803726677754952), np.float64(13.11026081862832))
There are several possible causes of this apparent difference:
-
There might be an actual difference in average pregnancy length between first babies and others.
-
The apparent difference we see in this dataset might be the result of bias in the sampling process — that is, the selection of survey respondents.
-
The apparent difference might be the result of measurement error — for example, the self-reported pregnancy lengths might be more accurate for first babies or others.
-
The apparent difference might be the result of random variation in the sampling process.
In later chapters, we will consider these possible explanations more carefully, but for now we will take this result at face value: in this dataset, there is a small difference in pregnancy length between these groups.

