Section 6.4 Comparing PMFs and PDFs
It is a common error to compare the PMF of a sample with the PDF of a theoretical model. For example, suppose we want to compare the distribution of birth weights to a normal model. Here’s a
Pmf that represents the distribution of the data.
pmf_birth_weight = Pmf.from_seq(birth_weights, name="data")
And we already have
pdf_model, which represents the PDF of the normal distribution with the same mean and standard deviation. Here’s what happens if we plot them on the same axis.
pdf_model.plot(ls=":", color="gray")
pmf_birth_weight.plot()

decorate(xlabel="Birth weight (pounds)", ylabel="PMF? Density?")
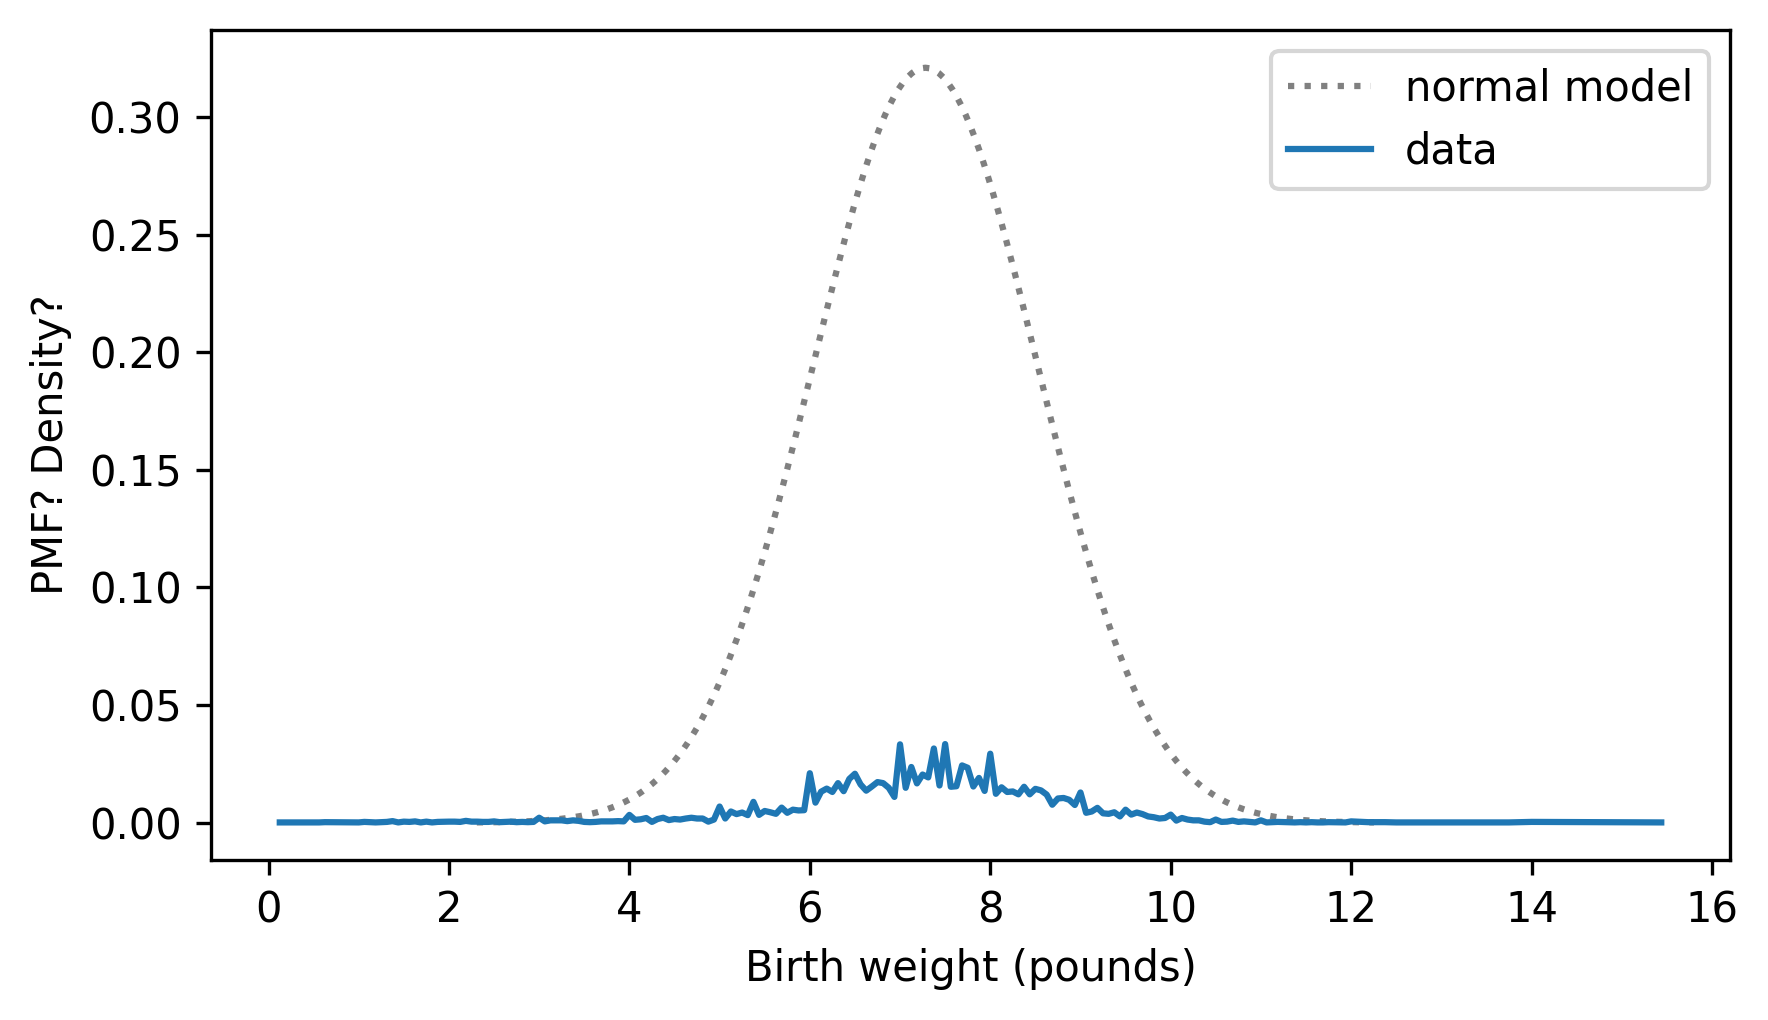
It doesn’t work very well. One reason is that they are not in the same units. A PMF contains probability masses and a PDF contains probability densities, so we can’t compare them, and we shouldn’t plot them on the same axes.
As a first attempt to solve the problem, we can make a
Pmf that approximates the normal distribution by evaluating the PDF at a discrete set of points. NormalPdf provides a make_pmf method that does that.
pmf_model = pdf_model.make_pmf()
The result is a normalized
Pmf that contains probability masses, so we can at least plot it on the same axes as the PMF of the data.
pmf_model.plot(ls=":", color="gray")
pmf_birth_weight.plot()

decorate(xlabel="Birth weight (pounds)", ylabel="PMF")
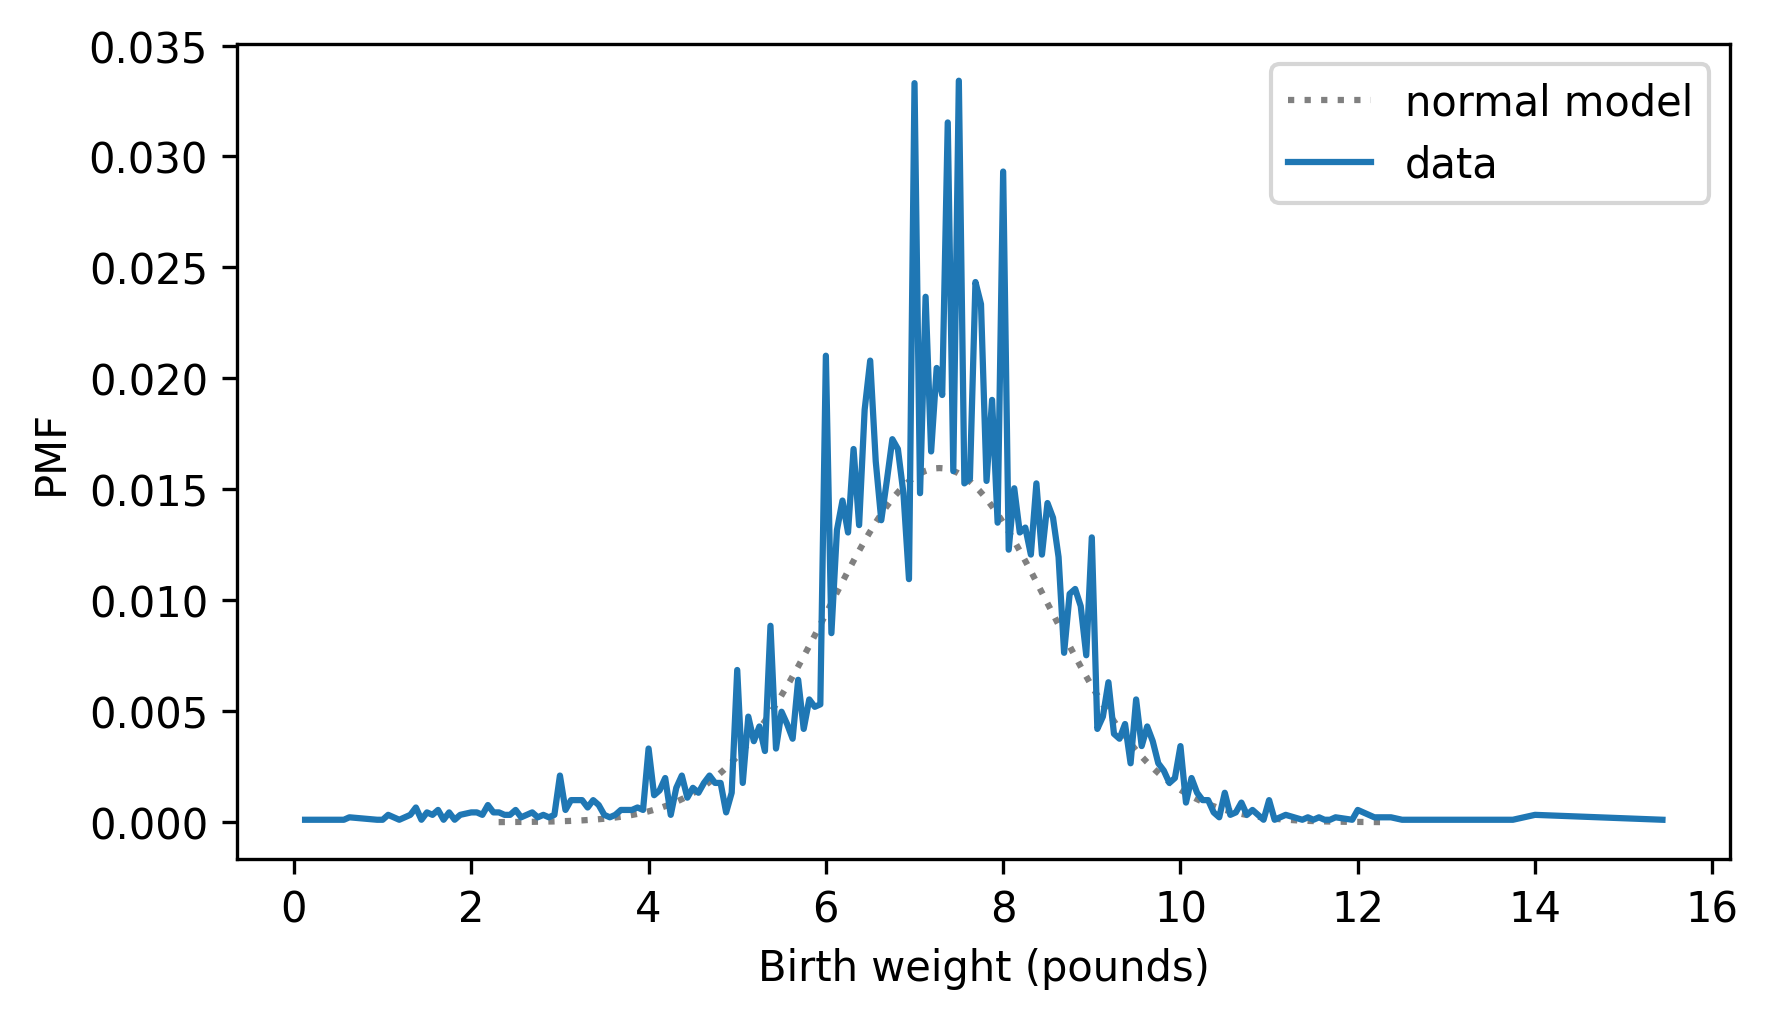
But this is still not a good way to compare distributions. One problem is that the two
Pmf objects contain different numbers of quantities, and the quantities in pmf_birth_weight are not equally spaced, so the probability masses are not really comparable.
$ len(pmf_model), len(pmf_birth_weight)
(201, 184)
The other problem is that the
Pmf of the data is noisy. So let’s try something else.

