Section 13.1 Survival Functions
A fundamental concept in survival analysis is the survival function, which is the fraction of a population that survives longer than a given duration. As a first example, we’ll compute a survival function for the lifespans of light bulbs.
We’ll use data from an experiment conducted in 2007. Researchers installed 50 new light bulbs and left them on continuously. They checked on the bulbs every 12 hours and recorded the lifespan of any that expired—and ran the experiment until all 50 bulbs expired.
Dataset from: V.J. Menon and D.C. Agrawal, Renewal Rate of Filament Lamps: Theory and Experiment. Journal of Failure Analysis and Prevention. December 2007, p. 421, Table 2. DOI: 10.1007/s11668-007-9074-9
download(
    "https://gist.github.com/epogrebnyak/7933e16c0ad215742c4c104be4fbdeb1/raw/c932bc5b6aa6317770c4cbf43eb591511fec08f9/lamps.csv"
)
We can read the data like this.
df = pd.read_csv("lamps.csv", index_col=0)
df.tail()
       h  f  K
i
28  1812  1  4
29  1836  1  3
30  1860  1  2
31  1980  1  1
32  2568  1  0
The
h column contains lifespans in hours. The f column records the number of bulbs that expired at each value of h. To represent the distribution of lifespans, we’ll put these values in a Pmf object and normalize it.
from empiricaldist import Pmf

pmf_bulblife = Pmf(df["f"].values, index=df["h"])
pmf_bulblife.normalize()
np.int64(50)
We can use
make_cdf to compute the CDF, which indicates the fraction of bulbs that expire at or before each value of h. For example, 78% of the bulbs expire at or before 1656 hours.
cdf_bulblife = pmf_bulblife.make_cdf()
cdf_bulblife[1656]
np.float64(0.7800000000000002)
The survival function is the fraction of bulbs that expire after each value of
h, which is the complement of the CDF. So we can compute it like this.
complementary_cdf = 1 - cdf_bulblife
complementary_cdf[1656]
np.float64(0.21999999999999975)
22% of the bulbs expired after 1656 hours.
The
empiricaldist library provides a Surv object that represents a survival function, and a method called make_surv that makes one.
surv_bulblife = cdf_bulblife.make_surv()
surv_bulblife[1656]
np.float64(0.21999999999999997)
If we plot the CDF and the survival function, we can see that they are complementary—that is, their sum is 1 at all values of
h.
cdf_bulblife.plot(ls="--", label="CDF")
surv_bulblife.plot(label="Survival")

decorate(xlabel="Light bulb duration (hours)", ylabel="Probability")
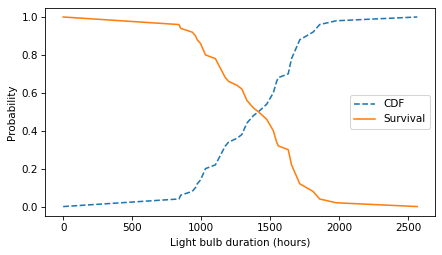
In that sense, the CDF and survival function are equivalent—if we are given either one, we can compute the other—but in the context of survival analysis it is more common to work with survival curves. And computing a survival curve is a step toward the next important concept, the hazard function.

