Section 9.3 Other Test Statistics
We might wonder whether there is a difference in variability of pregnancy lengths between first babies and others. To test that hypothesis, we can use as a test statistic the absolute difference between the standard deviations of the two groups. The following function computes this test statistic.
def abs_diff_stds(data):
    group1, group2 = data
    diff = np.std(group1) - np.std(group2)
    return np.abs(diff)
In the NSFG dataset, the difference in standard deviations is about 0.18.
$ observed_diff = abs_diff_stds(data)
observed_diff
np.float64(0.17600895913991677)
To see whether this difference might be due to chance, we can use permutation again. The following loop simulates the null hypothesis many times and computes the difference in standard deviation for each simulated dataset.
simulated_diffs = [abs_diff_stds(simulate_groups(data)) for i in range(1001)]
Here’s what the distribution of the results looks like. Again, the shaded region shows where the test statistic under the null hypothesis exceeds the observed difference.
pmf = make_pmf(simulated_diffs, 0, 0.5)
pmf.plot()
fill_tail(pmf, observed_diff, "right")
decorate(xlabel="Absolute difference in std (weeks)", ylabel="Density")
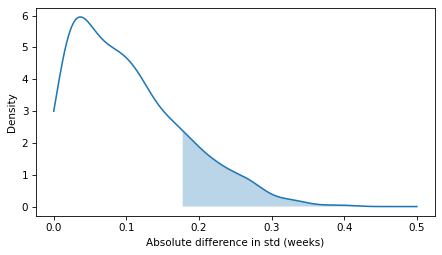
We can estimate the area of this region by computing the fraction of results that are as big or bigger than the observed difference.
$ compute_p_value(simulated_diffs, observed_diff)
np.float64(0.17082917082917082)
The p-value is about 0.17, so it is plausible that we could see a difference this big even if the two groups are the same. In conclusion, we can’t be sure that pregnancy lengths are generally more variable for first babies -- the difference we see in this dataset could be due to chance.

