Section 13.6 Estimating Survival Functions
If we are given a survival function, we know how to compute the hazard function. Now let’s go in the other direction.
Here’s one way to think of it. The hazard function indicates the probability of getting married at each age, if you have not already married. So the complement of the hazard function is the probability of staying unmarried at each age.
In order to “survive” past a given age,
t, you have to stay unmarried at every age up to and including t. And the probability of doing that is the product of the complementary hazard function, which we can compute like this.
ps = (1 - hazard).cumprod()
surv = hazard.make_surv()
Here’s what the result looks like, compared to the previous result (dotted line), which corrected for stratified resampling, but did not handle censored data.
survs_resampled[1960].plot(ls=":", color="gray", label="resampled")
surv.plot(label="Kaplan-Meier")

decorate(xlabel="Age", ylabel="Prob never married", ylim=ylim)
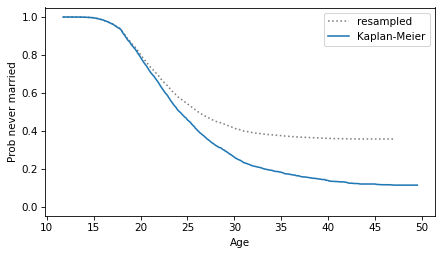
We can see how important it is to handle censored data correctly.
A survival function like this was the basis of a famous magazine article in 1986—Newsweek reported that a 40-year old unmarried woman was “more likely to be killed by a terrorist” than get married. That claim was widely reported and became part of popular culture, but it was wrong then (because it was based on faulty analysis) and turned out to be even more wrong (because of cultural changes that were already in progress). In 2006, Newsweek ran an another article acknowledging their error.
I encourage you to read more about this article, the statistics it was based on, and the reaction. It should remind you of the ethical obligation to perform statistical analysis with care, interpret the results with appropriate skepticism, and present them to the public accurately and honestly.
The following function encapsulates the steps of Kaplan-Meier estimation. It takes as arguments sequences of survival times for complete and ongoing cases, and returns a
Hazard object.
def estimate_hazard(complete, ongoing):
    """Kaplan-Meier estimation."""
    ft_complete = FreqTab.from_seq(complete)
    ft_ongoing = FreqTab.from_seq(ongoing)

    surv_complete = ft_complete.make_surv()
    surv_ongoing = ft_ongoing.make_surv()

    ts = pd.Index.union(ft_complete.index, ft_ongoing.index)
    at_risk = ft_complete(ts) + ft_ongoing(ts) + surv_complete(ts) + surv_ongoing(ts)

    hs = ft_complete(ts) / at_risk
    return Hazard(hs, ts)
And here’s a function that takes a group of respondents, extracts survival times, calls
estimate_hazard to get the hazard function, and then computes the corresponding survival function.
def estimate_survival(group):
    """Estimate the survival function."""
    complete = group.query("evrmarry == 1")["agemarr"]
    ongoing = group.query("evrmarry == 0")["age"]
    hf = estimate_hazard(complete, ongoing)
    sf = hf.make_surv()
    return sf
Soon we’ll use these functions to compute confidence intervals for survival functions. But first let’s see another way to compute Kaplan-Meier estimates.

