Section 2.1 Frequency Tables
One way to describe a variable is a frequency table, which contains the values of the variable and their frequencies — that is, the number of times each value appears. This description is called the distribution of the variable.
To represent distributions, we’ll use a library called
empiricaldist. In this context, "empirical" means that the distributions are based on data rather than mathematical models. empiricaldist provides a class called FreqTab that we can use to compute and plot frequency tables. We can import it like this.
from empiricaldist import FreqTab
To show how it works, we’ll start with a small list of values.
t = [1.0, 2.0, 2.0, 3.0, 5.0]
$ ftab = FreqTab.from_seq(t)
ftab
1.0    1
2.0    2
3.0    1
5.0    1
Name: , dtype: int64
A
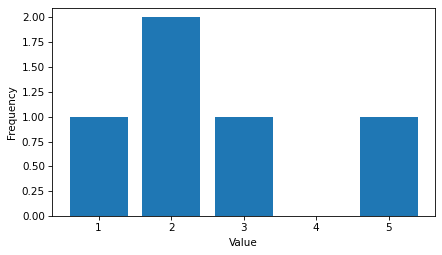
FreqTab object is a kind of Pandas Series that contains values and their frequencies. In this example, the value 1.0 has frequency 1, the value 2.0 has frequency 2, etc.
ftab.bar()
decorate(xlabel="Value", ylabel="Frequency")
Because a
FreqTab is a Pandas Series, we can use the bracket operator to look up a value and get its frequency.
$ ftab[2.0]
np.int64(2)
$ ftab(2.0)
np.int64(2)
$ ftab(4.0)
0
A
FreqTab object has an attribute called qs that returns an array of values — qs stands for quantities, although technically not all values are quantities.
$ ftab.qs
array([1., 2., 3., 5.])
$ ftab.fs
array([1, 2, 1, 1])
$ for x, freq in ftab.items():
    print(x, freq)
1.0 1
2.0 2
3.0 1
5.0 1
We’ll see more
FreqTab methods as we go along.

