Section 13.7 Lifelines
A Python package called
lifelines provides tools for survival analysis, including functions that compute Kaplan-Meier estimates.
We can use it to confirm that the result in the previous section is correct. First we’ll compute the survival function using
estimate_survival.
try:
    import lifelines
except ImportError:
    %pip install lifelines
surv = estimate_survival(resp60)
Next we’ll compute it using
lifelines. First we’ll get the data into the format lifelines requires.
complete = complete.dropna()
durations = np.concatenate([complete, ongoing])
event_observed = np.concatenate([np.ones(len(complete)), np.zeros(len(ongoing))])
Now we can make a
KaplanMeierFitter object and fit the data.
from lifelines import KaplanMeierFitter

kmf = KaplanMeierFitter()
kmf.fit(durations=durations, event_observed=event_observed)
<lifelines.KaplanMeierFitter:"KM_estimate", fitted with 15389 total observations, 5468 right-censored observations>
After fitting the data, we can call the
plot function to display the results, which include the estimated survival function and a confidence interval—although the confidence interval is not correct in this case because it doesn’t correct for stratified sampling.
kmf.plot()

decorate(xlabel="Age", ylabel="Prob never married", ylim=ylim)
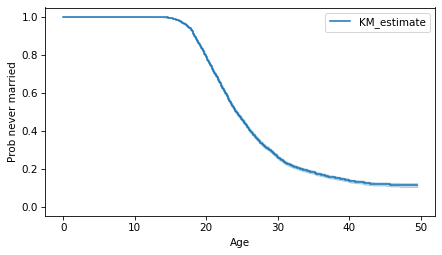
Unlike the survival function we computed, the one from
lifelines starts from 0. But the rest of the function is the same, within floating-point error.
ps = kmf.survival_function_["KM_estimate"].drop(0)
np.allclose(ps, surv)
True
In the next section, we’ll use weighted resampling to compute confidence intervals that take stratified sampling into account.

